Triangle breakout on FTSE 100Triangle breakout on FTSE 100
The breakout of FTSE 100 through the support line of a Triangle could be a sign of the road ahead. If this breakout persists, we may see the price of

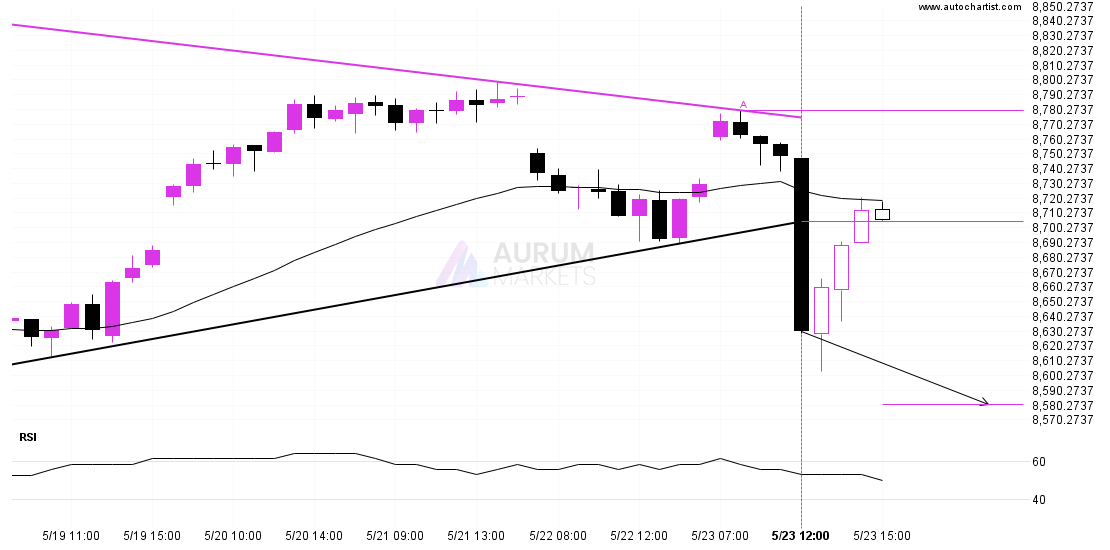
The breakout of FTSE 100 through the support line of a Triangle could be a sign of the road ahead. If this breakout persists, we may see the price of

The price of NZDUSD in heading in the direction of 0.6041. Despite the recent breakout through 0.5978 it is possible that it will struggle to gain momentum to the forecast
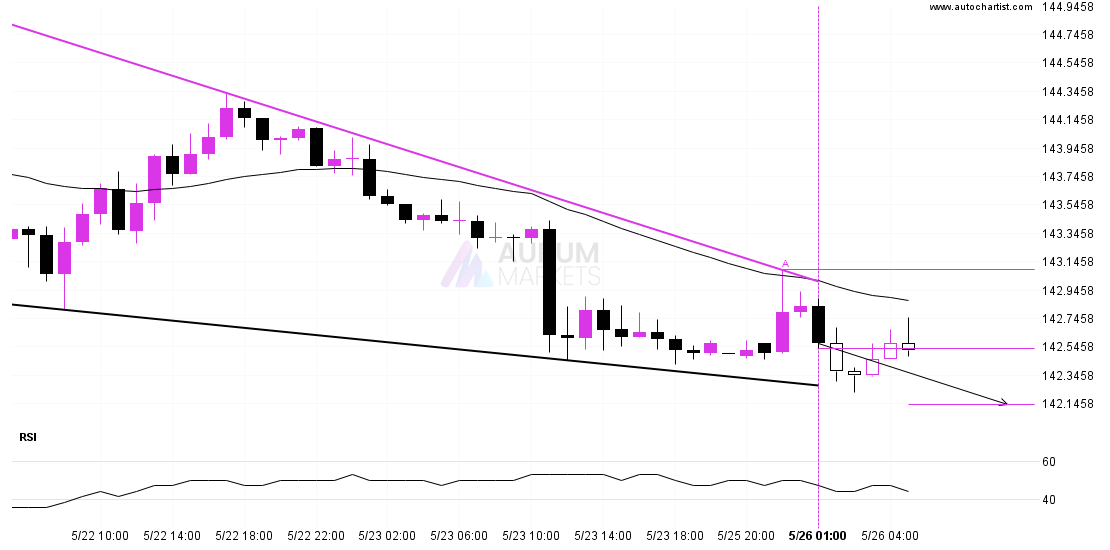
A Falling Wedge pattern was identified on USDJPY at 142.537, creating an expectation that it may move to the support line at 142.1436. It may break through that line and