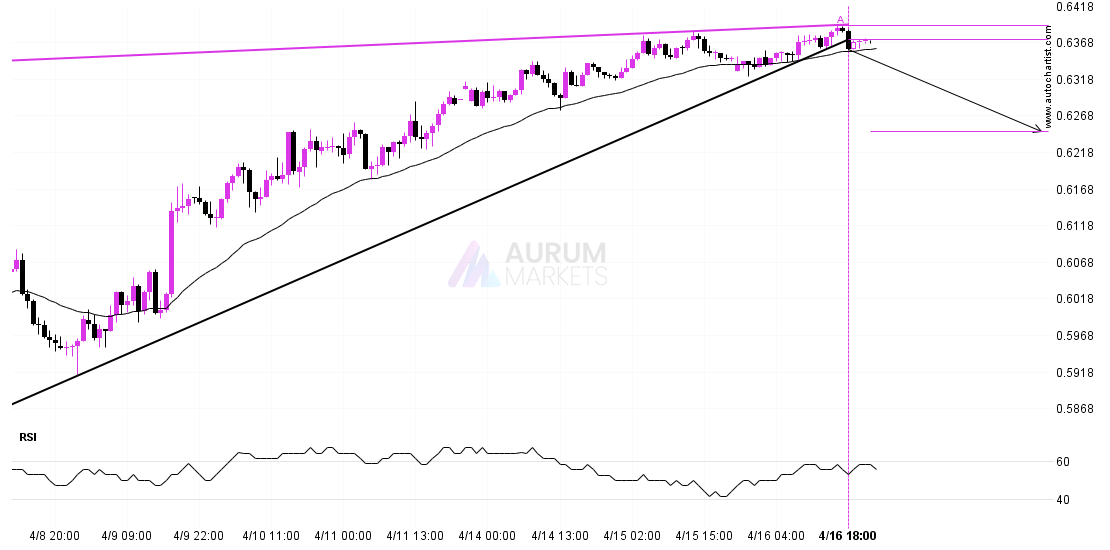
AUDUSD has broken through supportAUDUSD has broken through support
AUDUSD has broken through a support line of a Rising Wedge chart pattern. If this breakout holds true, we may see the price of AUDUSD testing 0.6247 within the next

AUDUSD has broken through a support line of a Rising Wedge chart pattern. If this breakout holds true, we may see the price of AUDUSD testing 0.6247 within the next
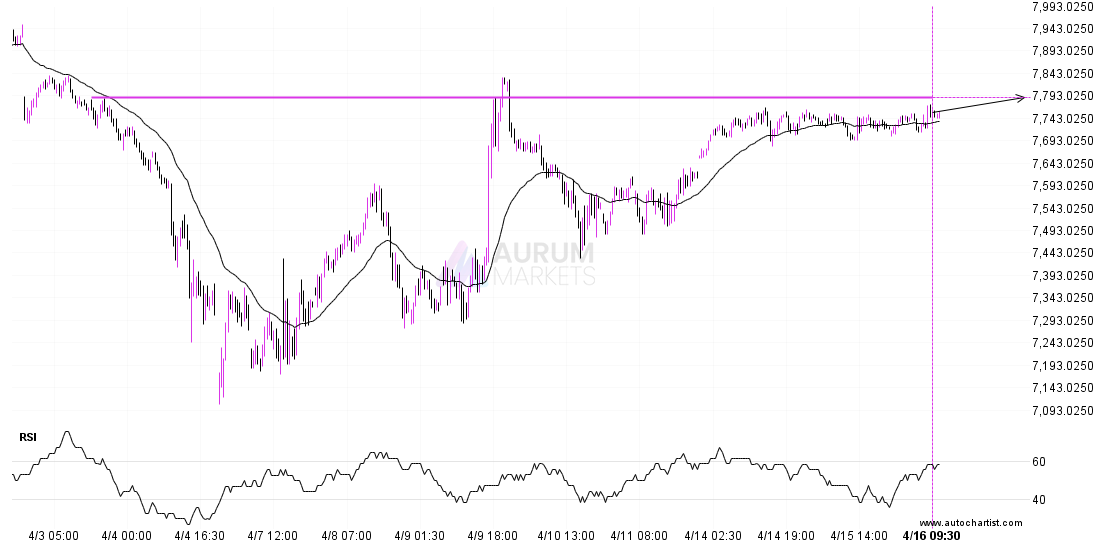
ASX 225 is moving towards a resistance line. Because we have seen it retrace from this level in the past, we could see either a break through this line, or
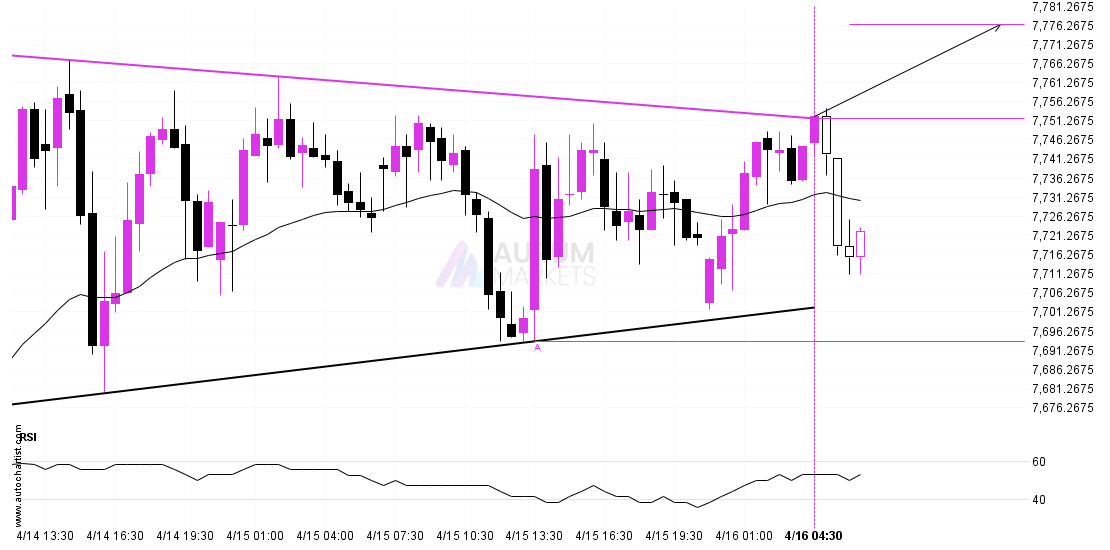
ASX 225 has broken through the resistance line of a Triangle technical chart pattern. Because we have seen it retrace from this line in the past, one should wait for

USDCHF is once again retesting a key horizontal resistance level at 0.8194. It has tested this level 3 times in the recent past and could simply bounce off like it

LTCUSD is trapped in a Rising Wedge formation, implying that a breakout is Imminent. This is a great trade-setup for both trend and swing traders. It is now approaching a

EURUSD is moving towards a key resistance level at 1.1385. EURUSD has previously tested this level 3 times and on each occasion it has bounced back off this level. Is

An emerging Channel Down has been detected on USDCAD on the 1 hour chart. There is a possible move towards 1.3819 next few candles. Once reaching resistance it may continue
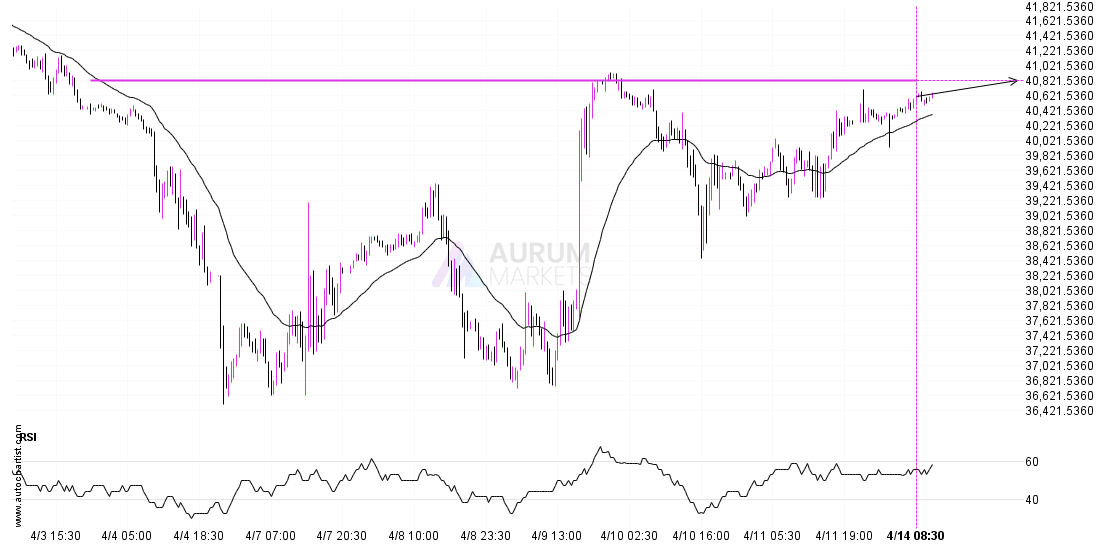
The price of DOW 30 in heading back to the resistance area. It is possible that it will struggle to break through it and move back in the other direction.
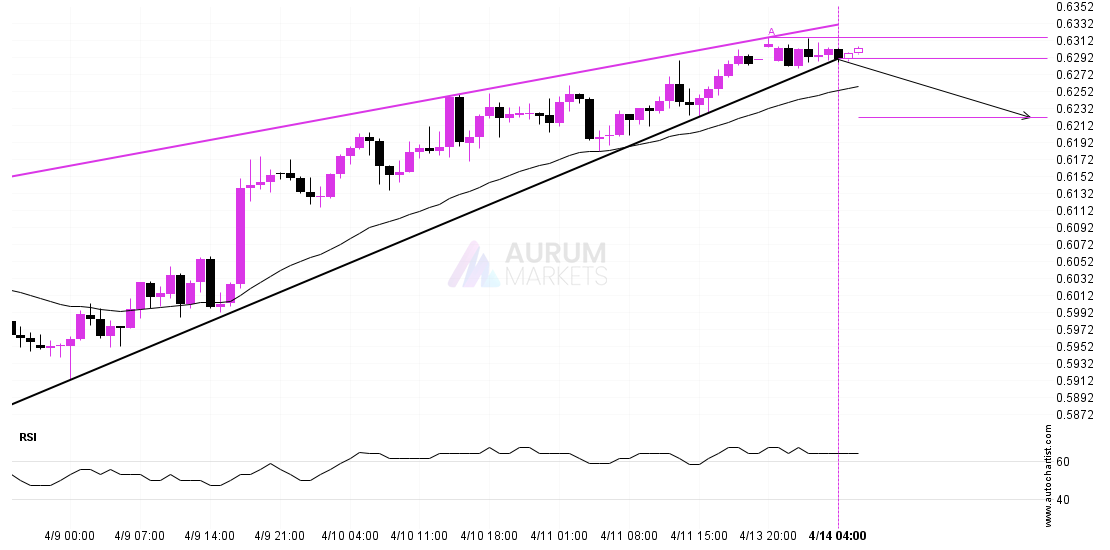
AUDUSD has broken through a support line of a Rising Wedge and suggests a possible movement to 0.6221 within the next 22 hours. It has tested this line in the
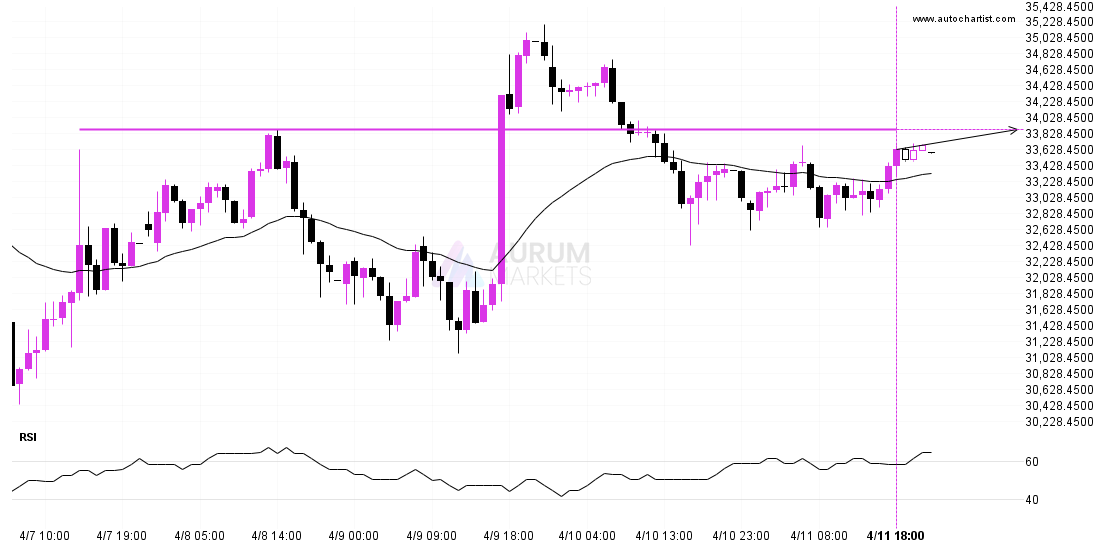
Nikkei 225 is heading towards a line of 33884.0000. If this movement continues, the price of Nikkei 225 could test 33884.0000 within the next 19 hours. But don’t be so