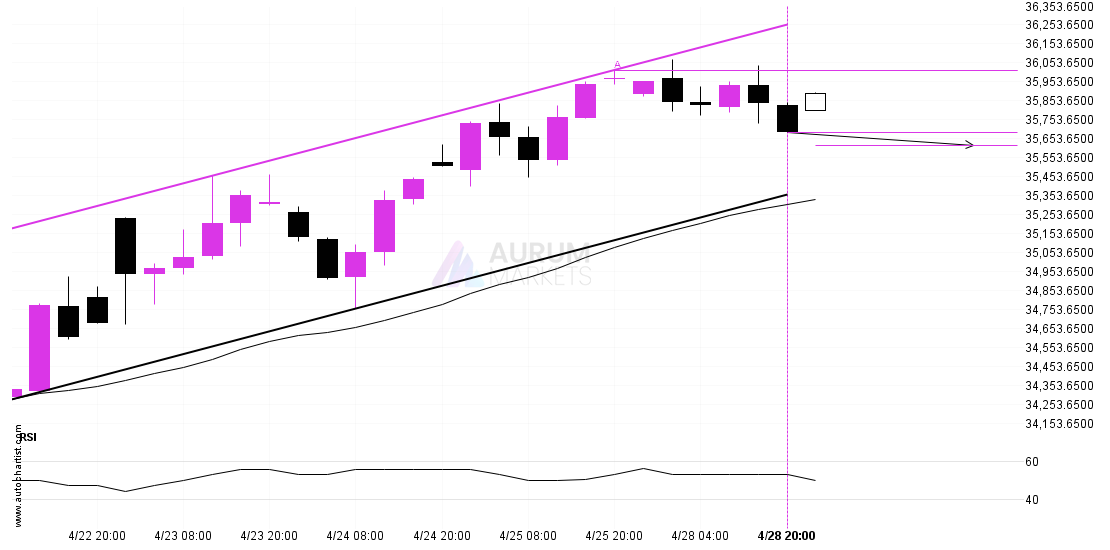
A potential bullish movement on FTSE 100A potential bullish movement on FTSE 100
Emerging Channel Up detected on FTSE 100 – the pattern is an emerging one and has not yet broken through support, but the price is expected to move up over

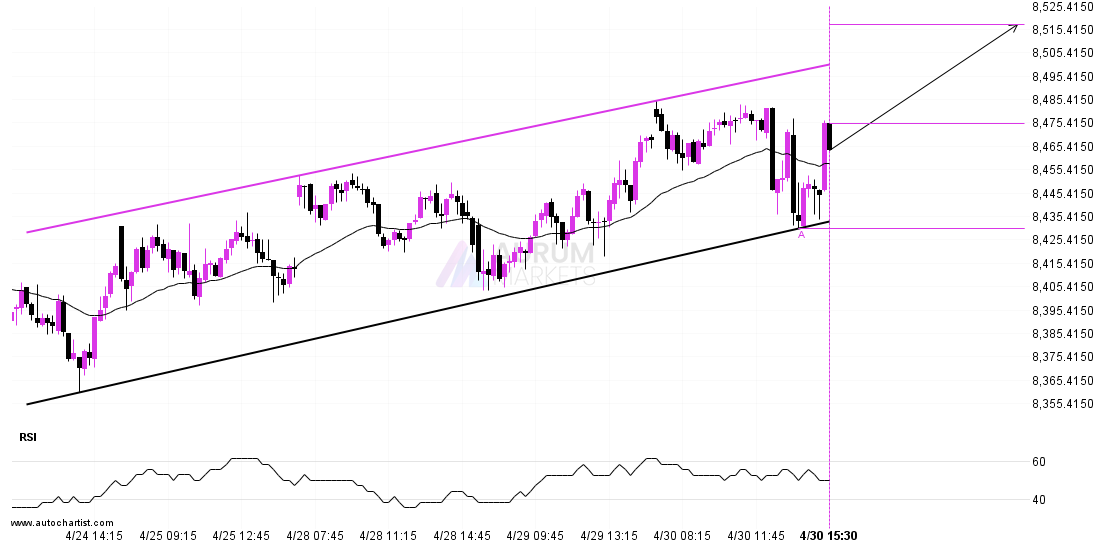
Emerging Channel Up detected on FTSE 100 – the pattern is an emerging one and has not yet broken through support, but the price is expected to move up over
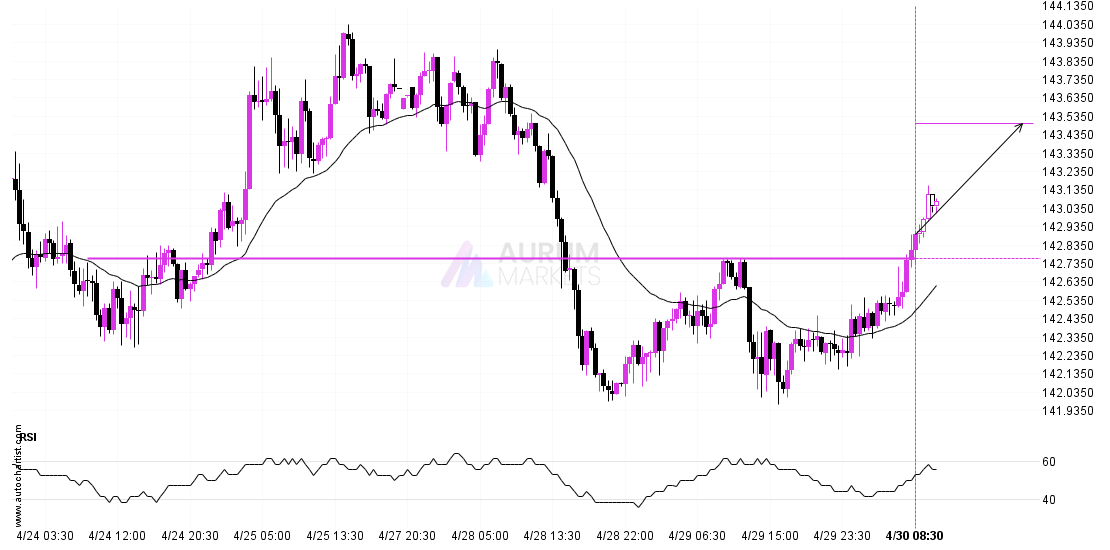
A strong resistance level has been breached at 142.7600 on the 30 Minutes USDJPY chart. Technical Analysis theory forecasts a movement to 143.4939 in the next 21 hours. Supported by
ASX 225 is trapped in a Rising Wedge formation, implying that a breakout is Imminent. This is a great trade-setup for both trend and swing traders. It is now approaching
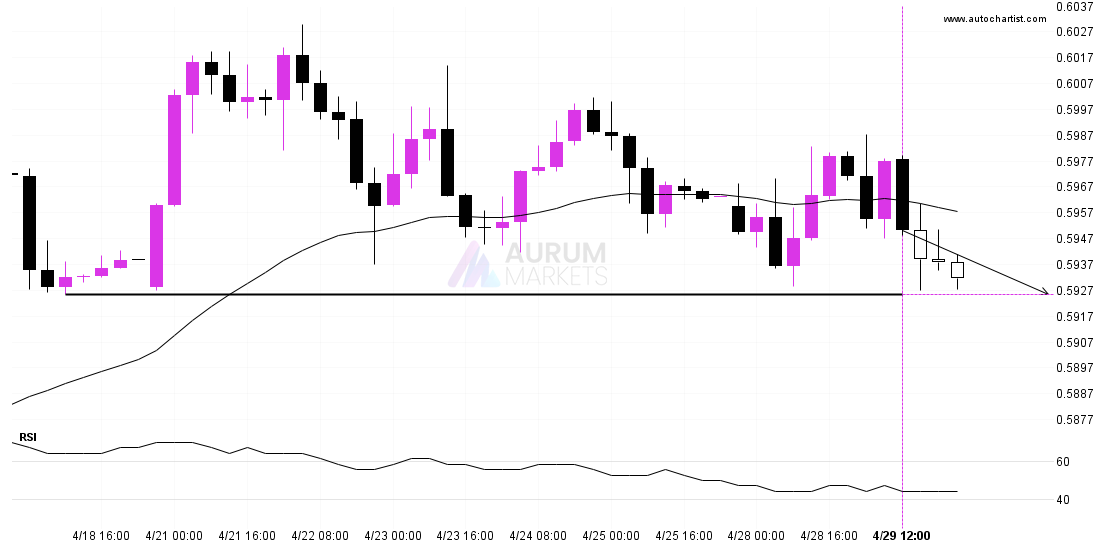
The price of NZDUSD in heading back to the support area. It is possible that it will struggle to break through it and move back in the other direction. The
Emerging Channel Up pattern in its final wave was identified on the Nikkei 225 4 hour chart. After a strong bearish run, we find Nikkei 225 heading towards the upper
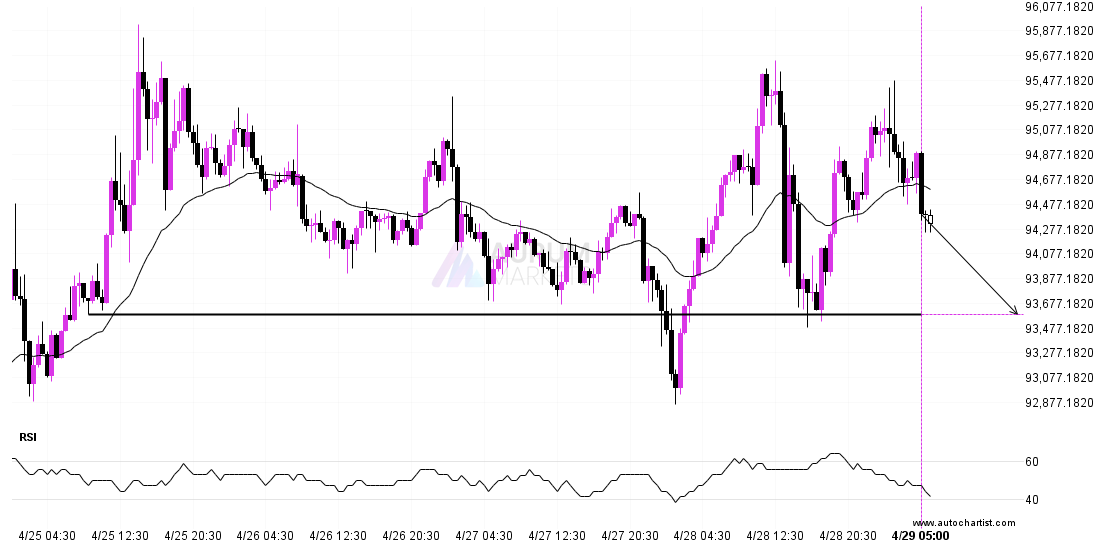
BTCUSD is moving towards a key support level at 93587.8203. BTCUSD has previously tested this level 4 times and on each occasion it has bounced back off this level. Is
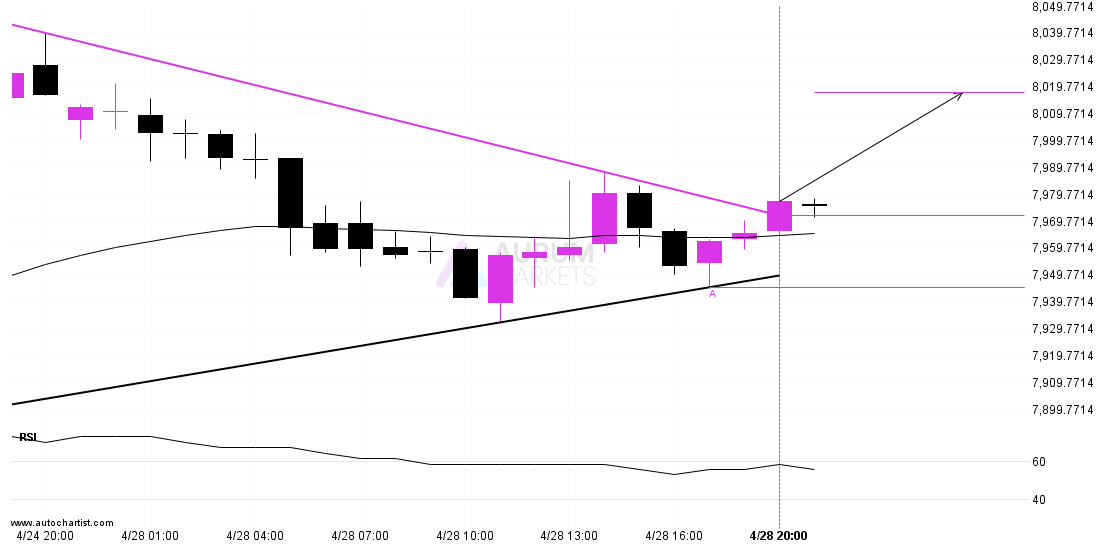
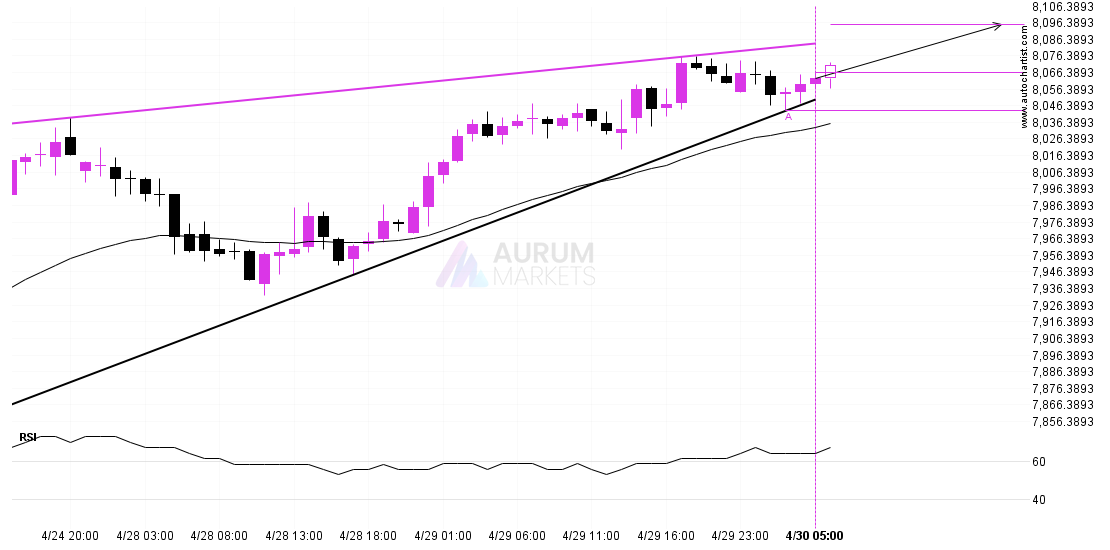
ASX 225 moved through the resistance line of a Pennant at 7971.90625 on the 1 hour chart. This line has been tested a number of times in the past and
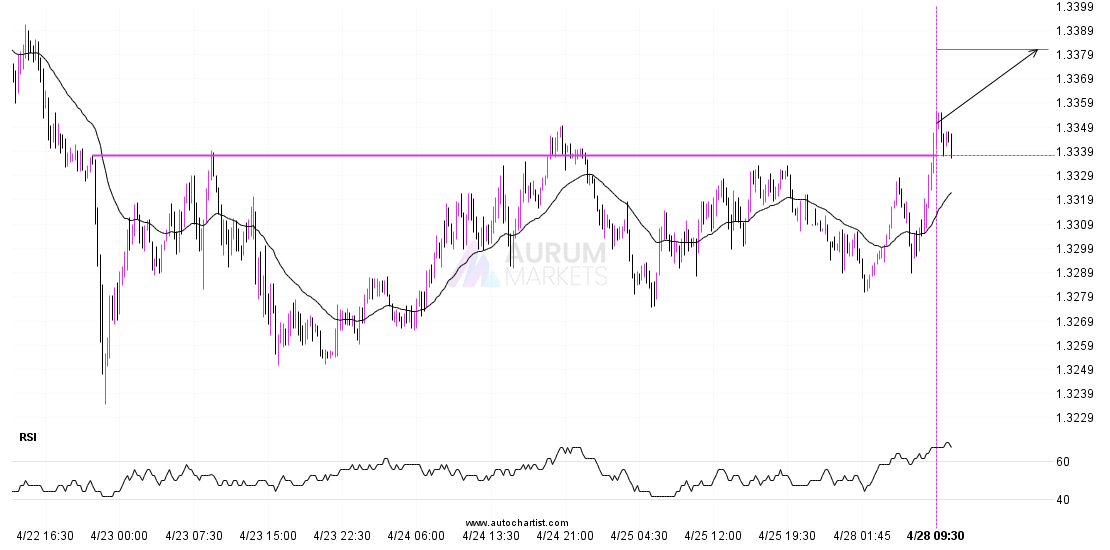
The price of GBPUSD in heading in the direction of 1.3381. Despite the recent breakout through 1.3337 it is possible that it will struggle to gain momentum to the forecast
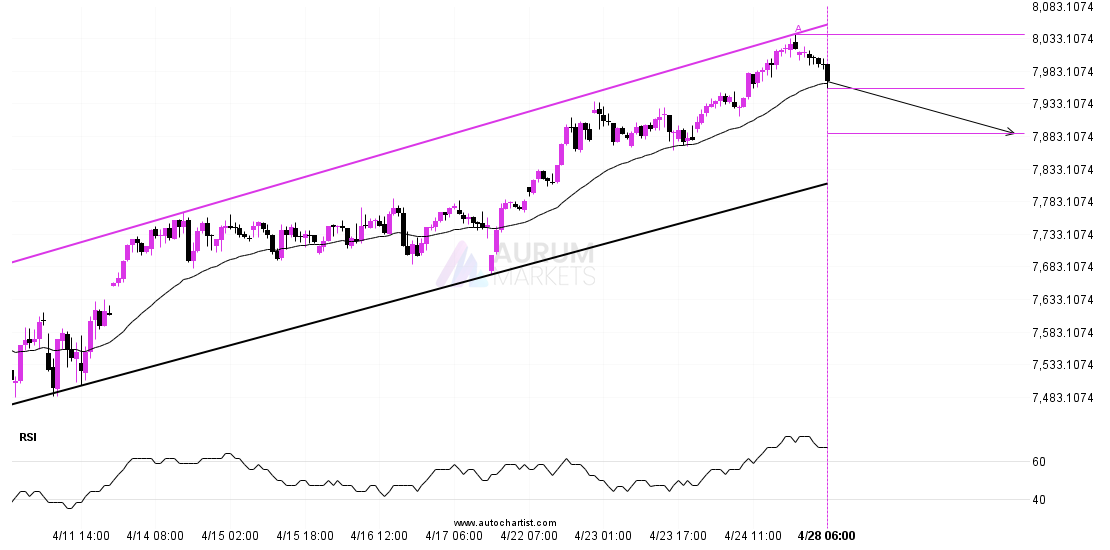
ASX 225 is heading towards the support line of a Channel Up. If this movement continues, the price of ASX 225 could test 7888.3636 within the next 3 days. It
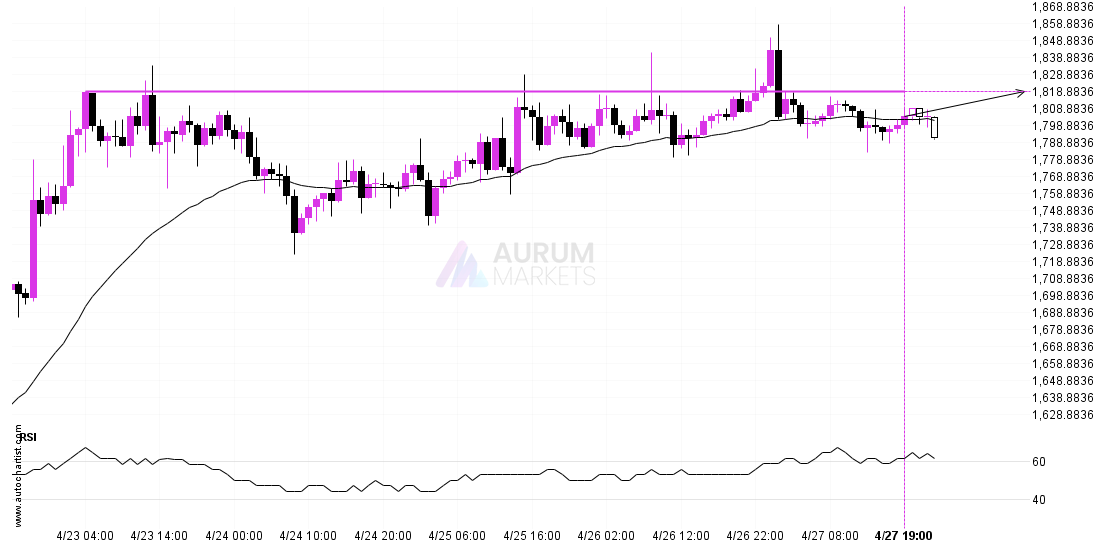
ETHUSD is moving towards a key resistance level at 1818.4100. ETHUSD has previously tested this level 4 times and on each occasion it has bounced back off this level. Is