A potential bullish movement on ETHUSDA potential bullish movement on ETHUSD
The price of ETHUSD in heading back to the resistance area. It is possible that it will struggle to break through it and move back in the other direction. The

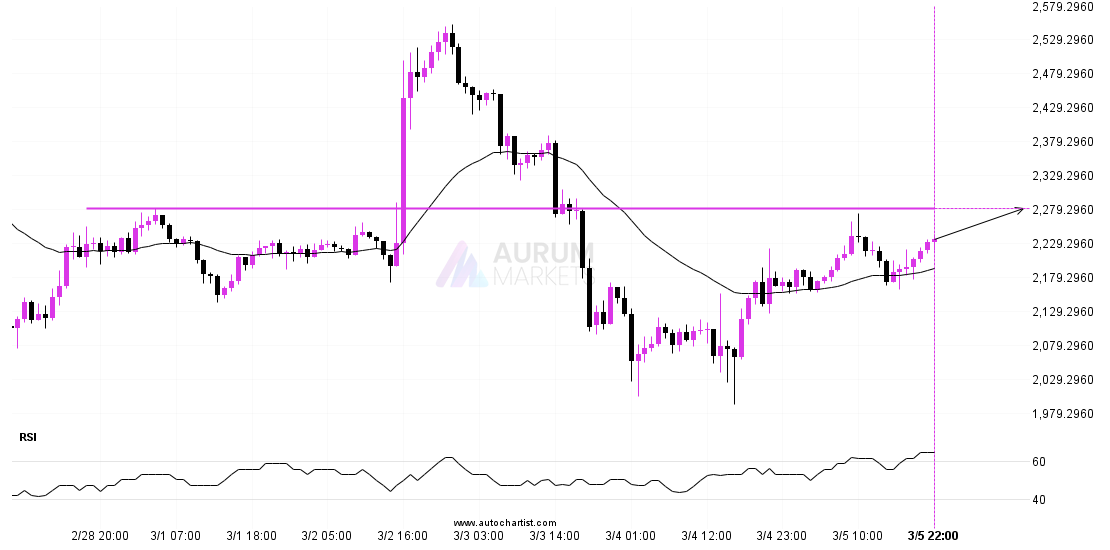
The price of ETHUSD in heading back to the resistance area. It is possible that it will struggle to break through it and move back in the other direction. The
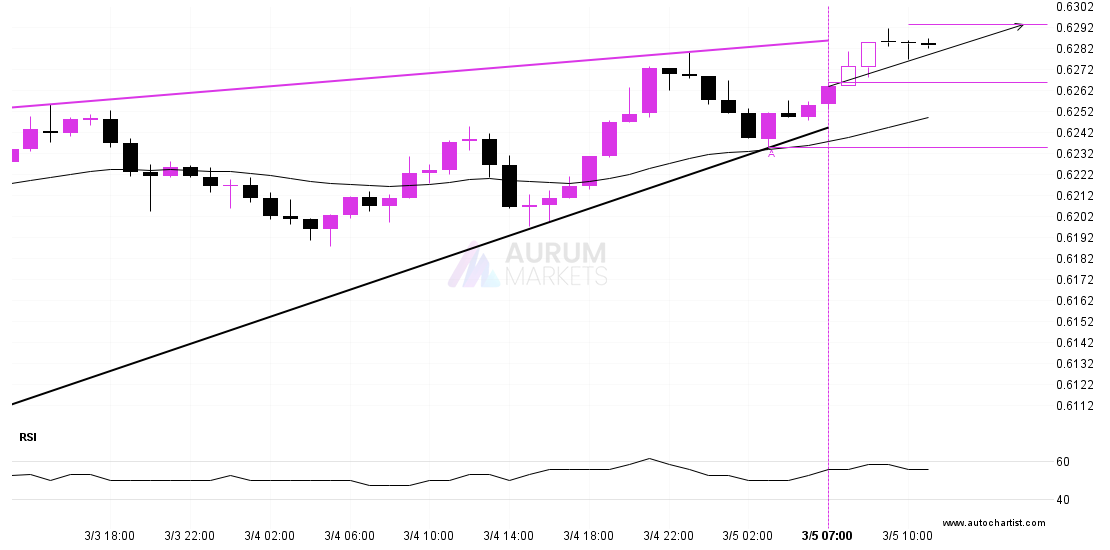
Emerging Rising Wedge detected on AUDUSD – the pattern is an emerging one and has not yet broken through support, but the price is expected to move up over the
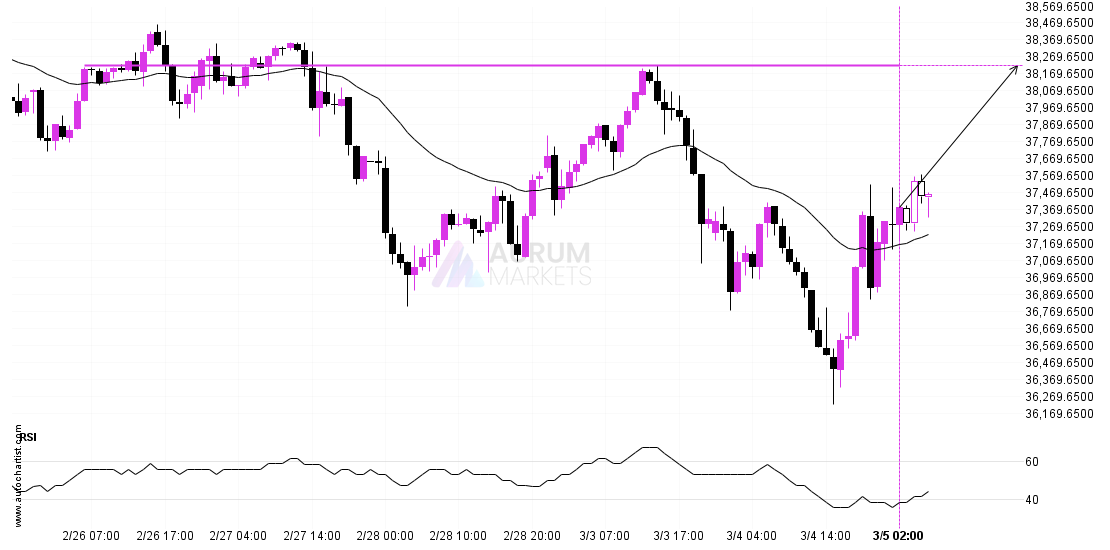
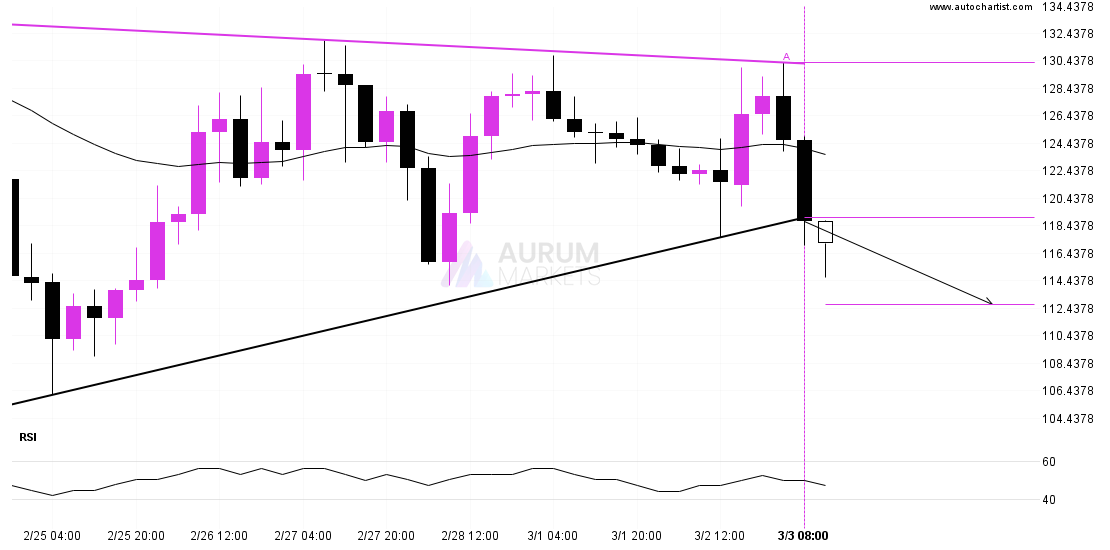
Nikkei 225 is moving towards a key resistance level at 38220.0000. Nikkei 225 has previously tested this level 3 times and on each occasion it has bounced back off this
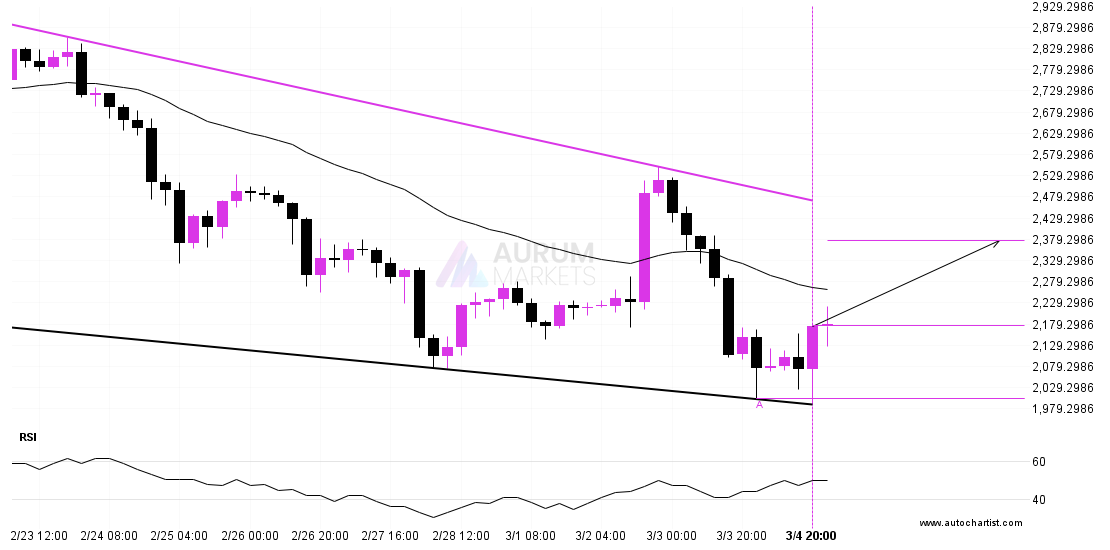
ETHUSD is approaching the resistance line of a Falling Wedge. It has touched this line numerous times in the last 12 days. If it tests this line again, it should
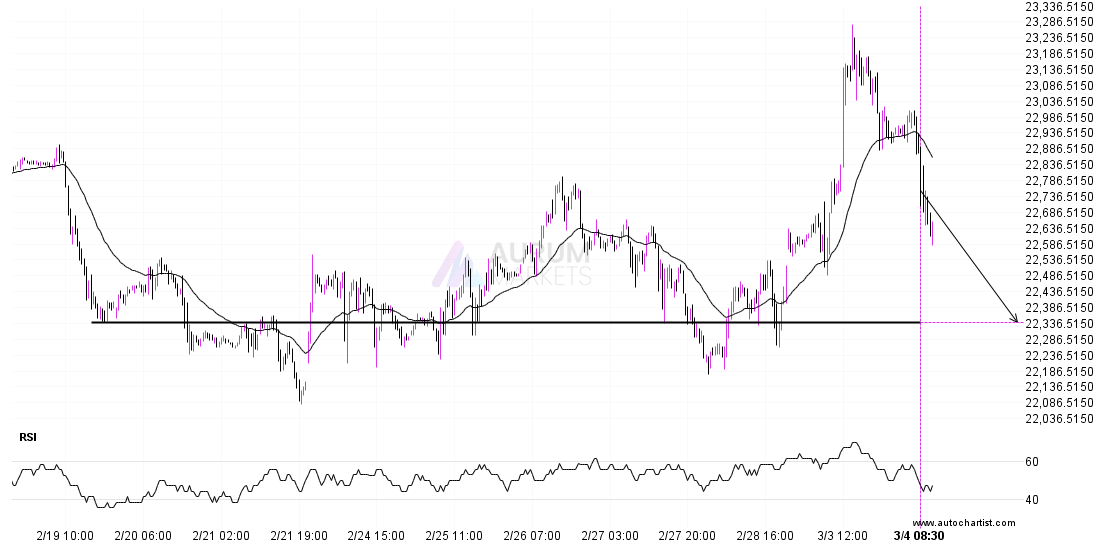
The price of DAX 40 in heading back to the support area. It is possible that it will struggle to break through it and move back in the other direction.
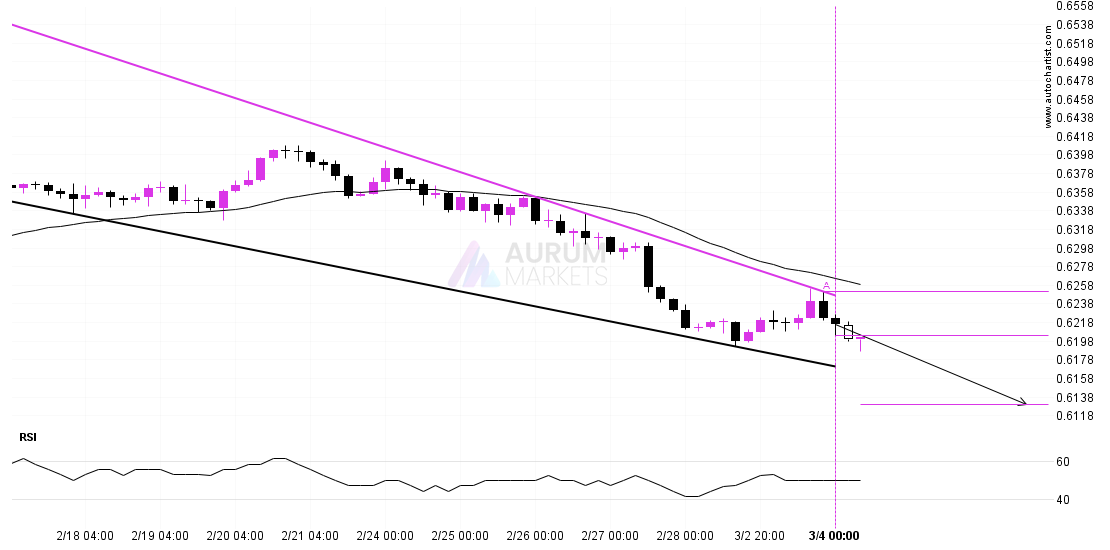
Emerging Falling Wedge detected on AUDUSD – the pattern is an emerging one and has not yet broken through resistance, but the price is expected to move up over the
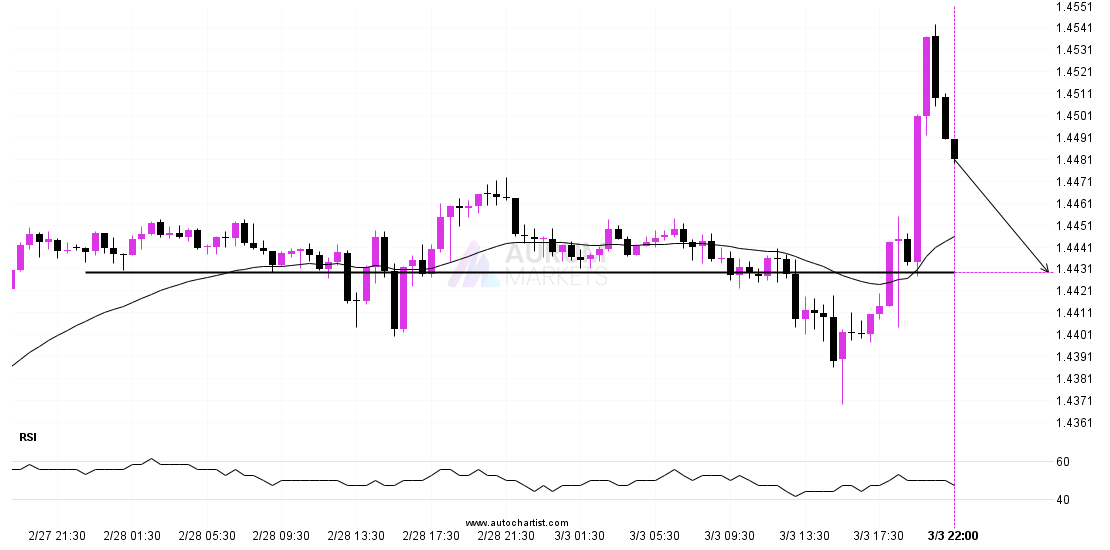
USDCAD is about to retest a key horizontal support level near 1.4429. It has tested this level 4 times in the recent past and could simply bounce off like it
This trade setup on LTCUSD is formed by a period of consolidation; a period in which the price primarily moves sideways before choosing a new direction for the longer term.
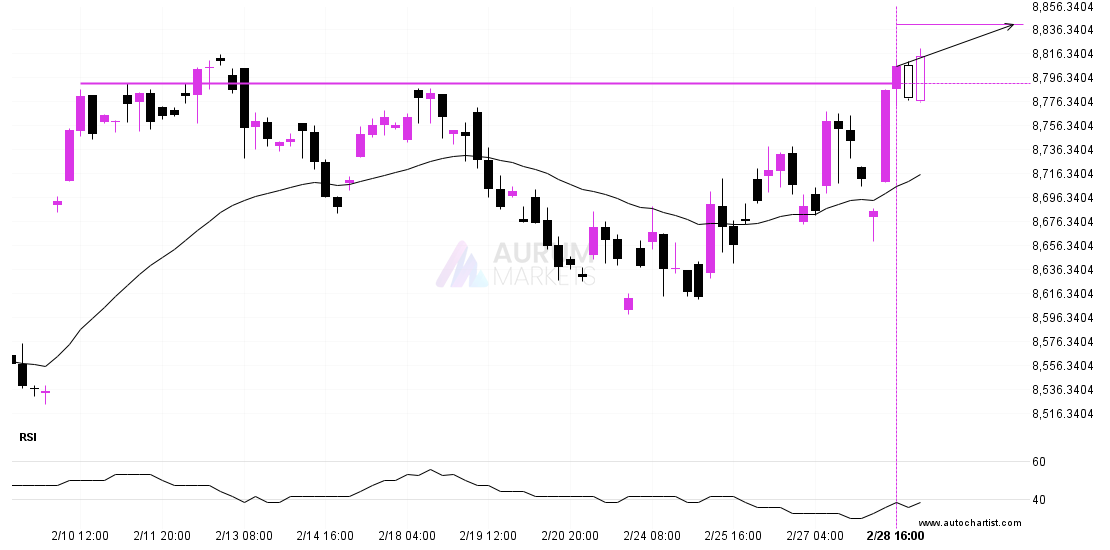
FTSE 100 has broken through a line of 8791.4502. If this breakout holds true, we could see the price of FTSE 100 heading towards 8840.5146 within the next 3 days.

The last 15 4 hour candles on DOW 30 formed a Falling Wedge pattern and broken out through the pattern lines, indicating a possible bullish movement towards the price level