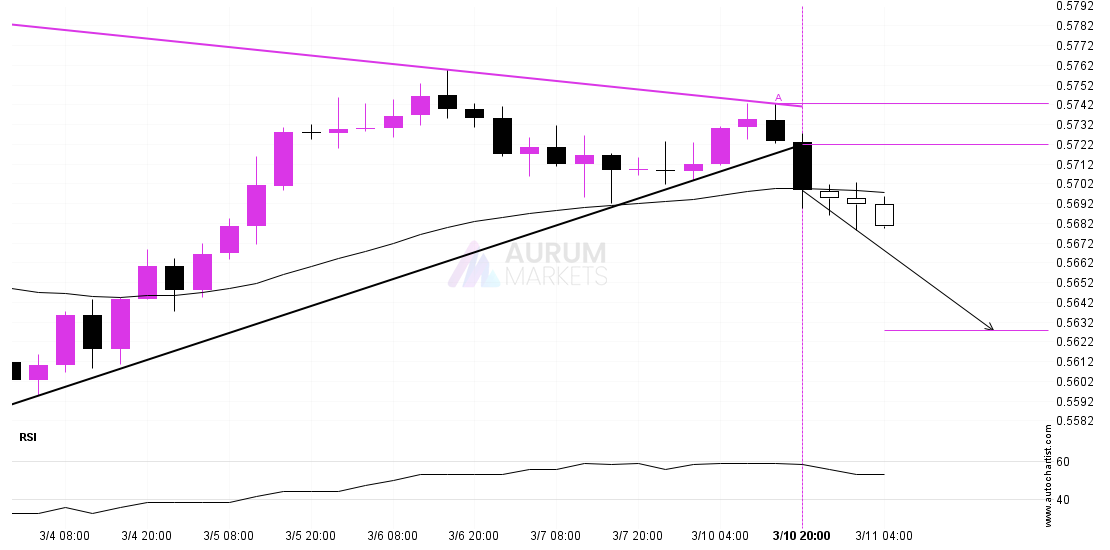
Pennant breakout on NZDUSDPennant breakout on NZDUSD
The last 15 4 hour candles on NZDUSD formed a Pennant pattern and broken out through the pattern lines, indicating a possible bearish movement towards the price level of 0.5628.

The last 15 4 hour candles on NZDUSD formed a Pennant pattern and broken out through the pattern lines, indicating a possible bearish movement towards the price level of 0.5628.
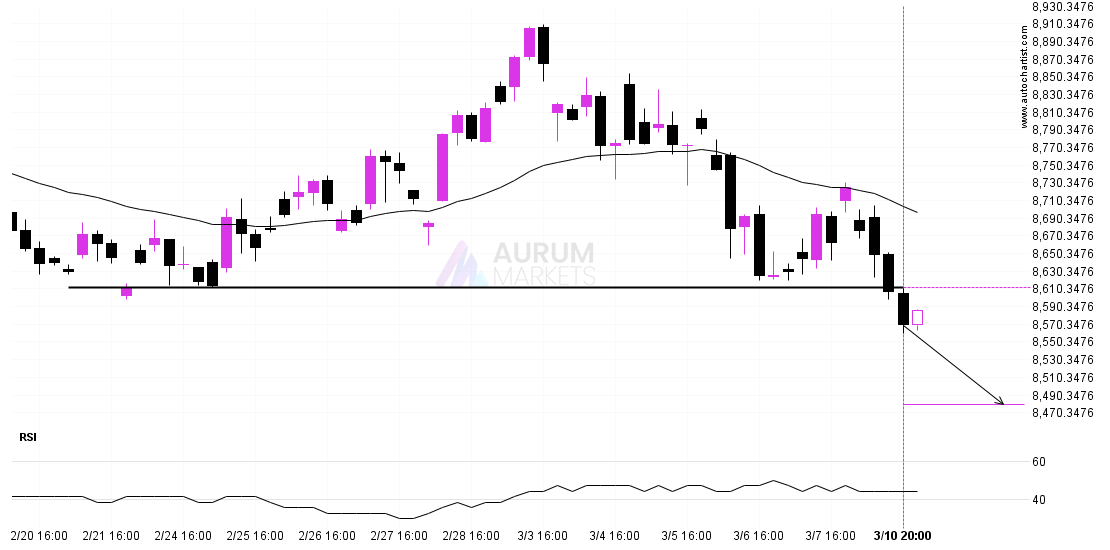
FTSE 100 has broken through 8611.7002 which it has tested numerous times in the past. We have seen it retrace from this price in the past. If this new trend
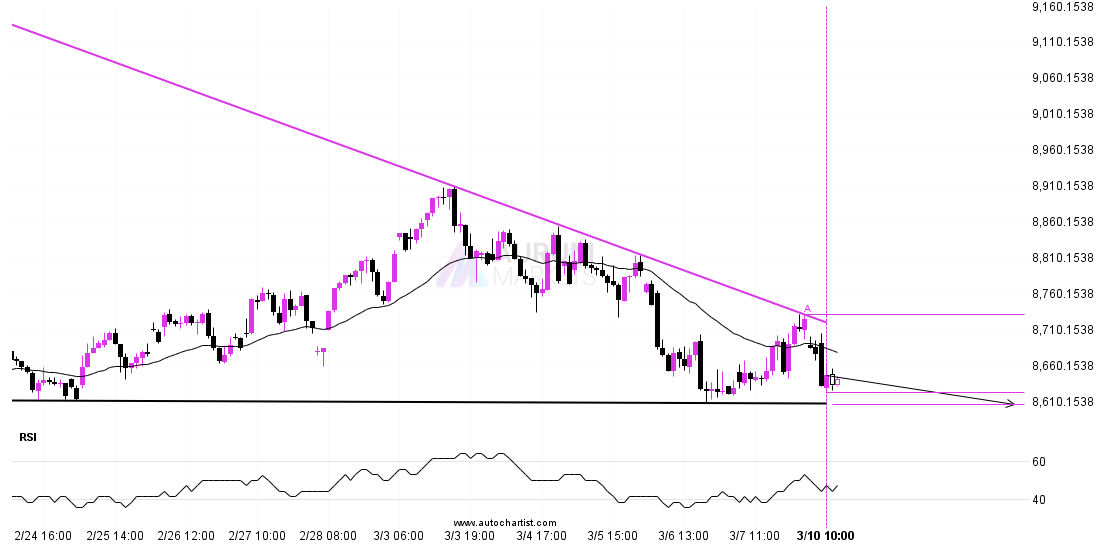
FTSE 100 is approaching the support line of a Descending Triangle. It has touched this line numerous times in the last 15 days. If it tests this line again, it

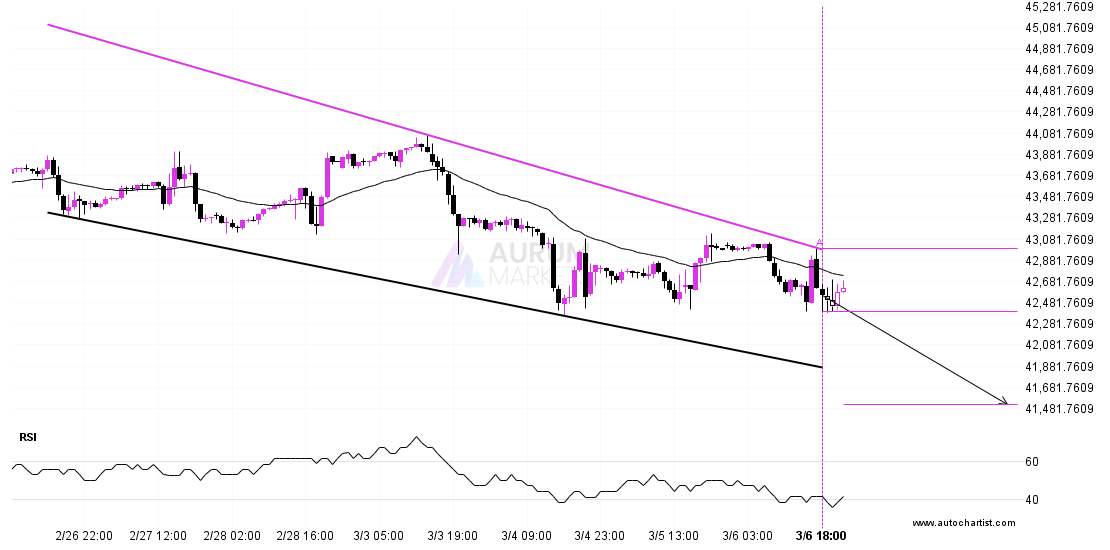
BTCUSD has broken through a support line. It has touched this line numerous times in the last 9 days. This breakout shows a potential move to 79226.7969 within the next

DOW 30 has broken through the resistance line which it has tested twice in the past. We have seen it retrace from this line before, so one should wait for
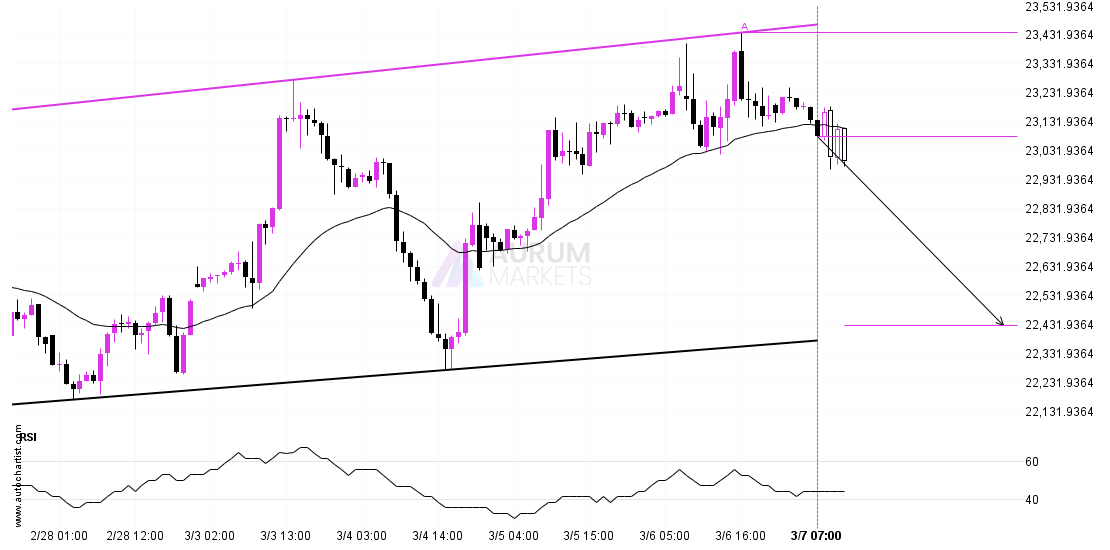
A Channel Up pattern was identified on DAX 40 at 23083.0, creating an expectation that it may move to the support line at 22428.5727. It may break through that line
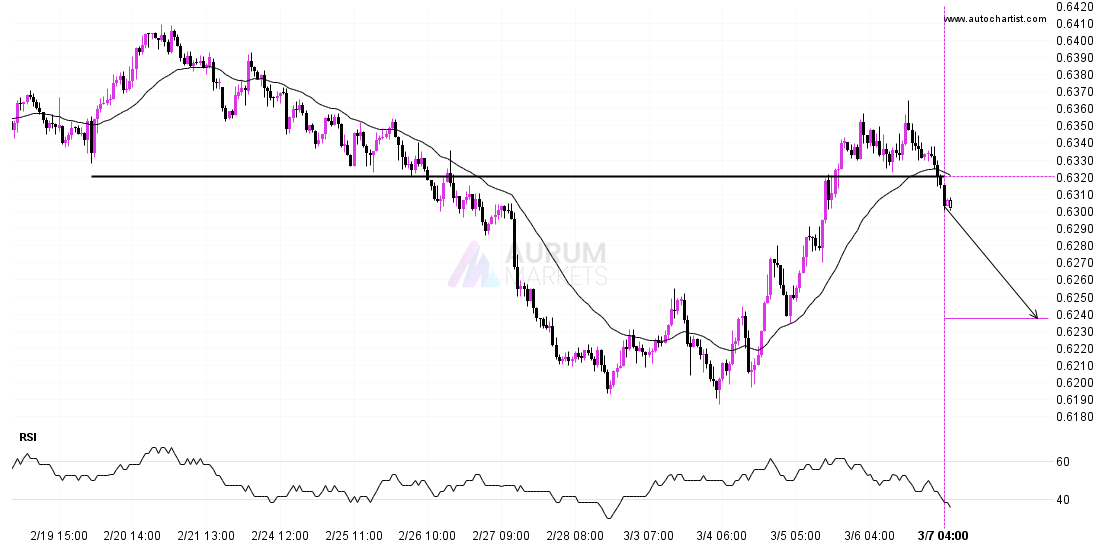
AUDUSD has broken through 0.6320 which it has tested numerous times in the past. We have seen it retrace from this price in the past. If this new trend persists,
DOW 30 is heading towards the support line of a Falling Wedge and could reach this point within the next 2 days. It has tested this line numerous times in

The breakout of FTSE 100 through the 8726.7002 price line is a breach of an important psychological price that is has tested numerous in the past. If this breakout persists,
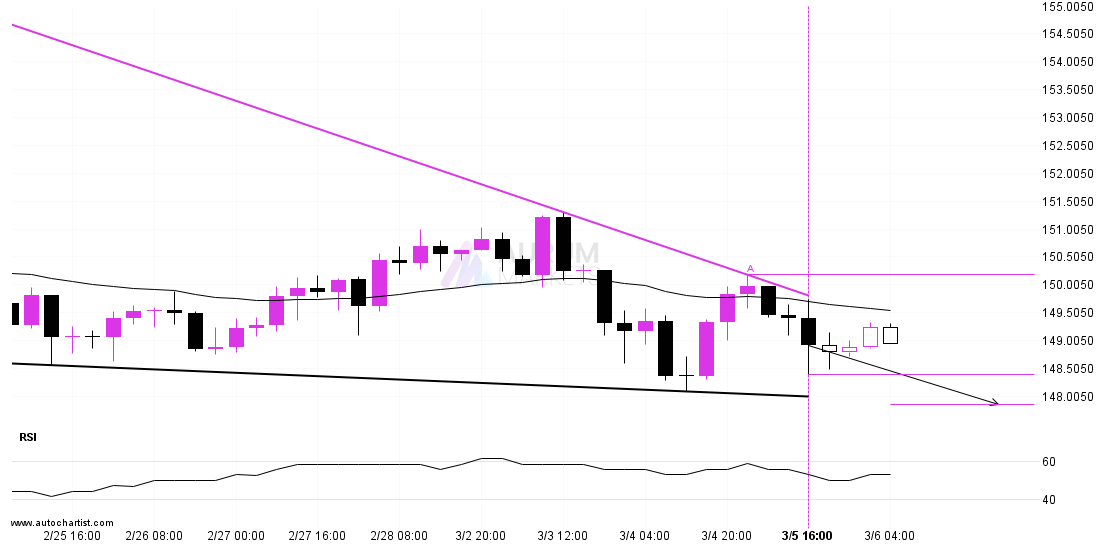
Emerging Falling Wedge pattern in its final wave was identified on the USDJPY 4 hour chart. After a strong bearish run, we find USDJPY heading towards the upper triangle line