Continuation pattern on Nikkei 225Continuation pattern on Nikkei 225
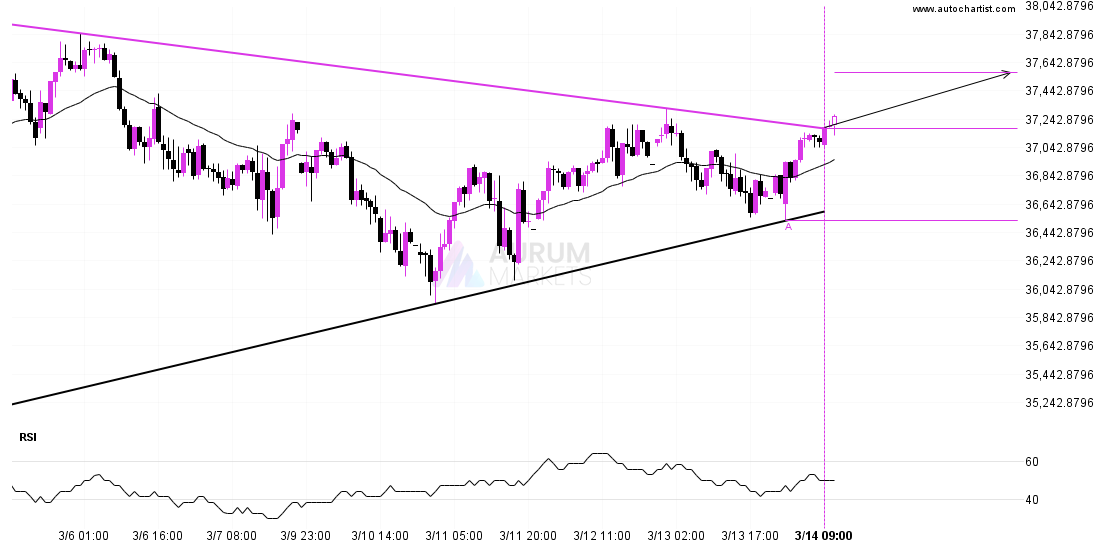
Nikkei 225 has broken through a resistance line. It has touched this line at least twice in the last 10 days. This breakout may indicate a potential move to 37575.9174

Nikkei 225 has broken through a resistance line. It has touched this line at least twice in the last 10 days. This breakout may indicate a potential move to 37575.9174
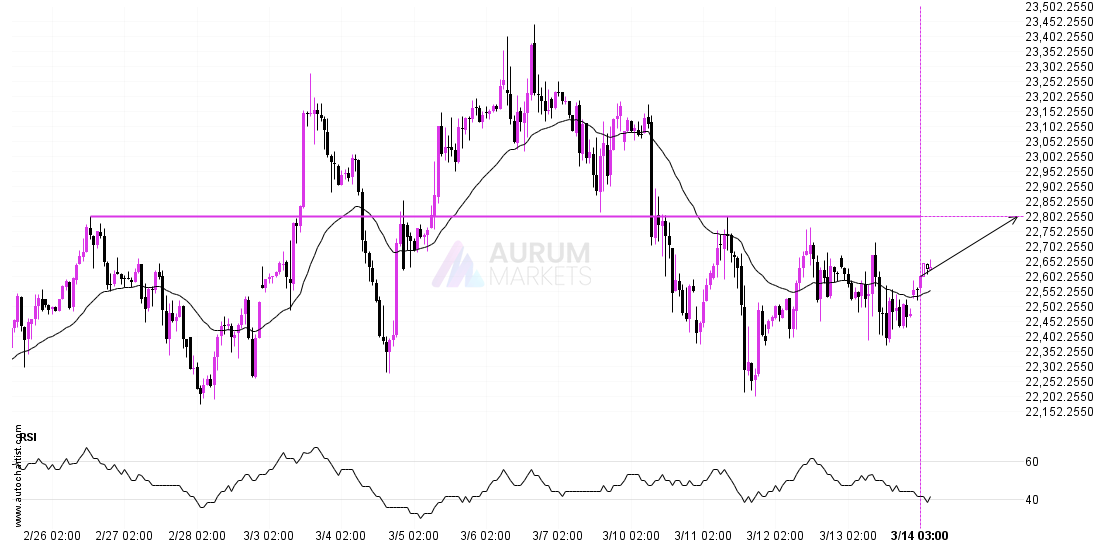
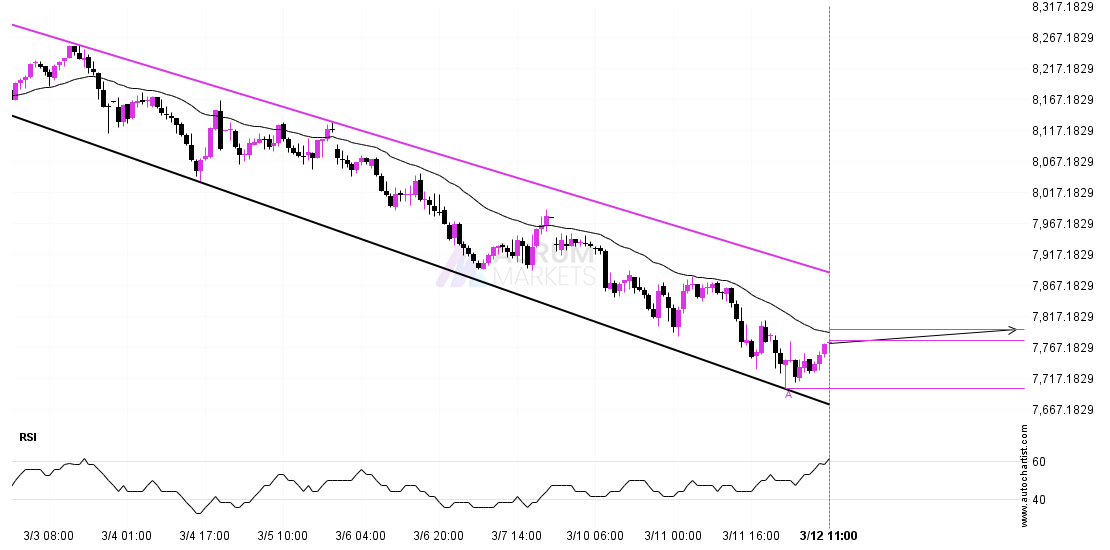
DAX 40 is heading towards 22802.1992 and could reach this point within the next 3 days. It has tested this line numerous times in the past, and this time could
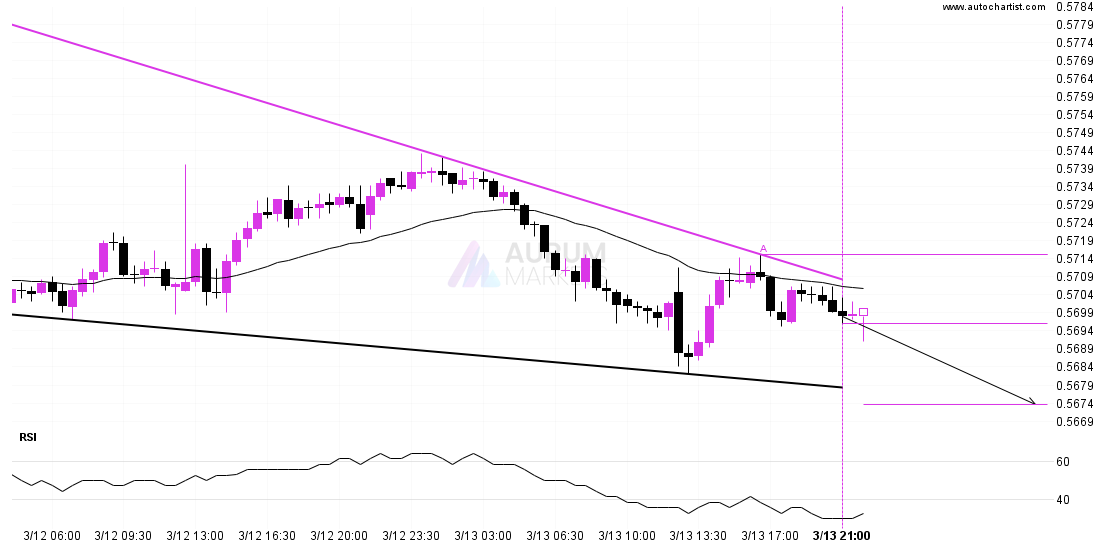
NZDUSD is heading towards the support line of a Falling Wedge. If this movement continues, the price of NZDUSD could test 0.5674 within the next 11 hours. It has tested
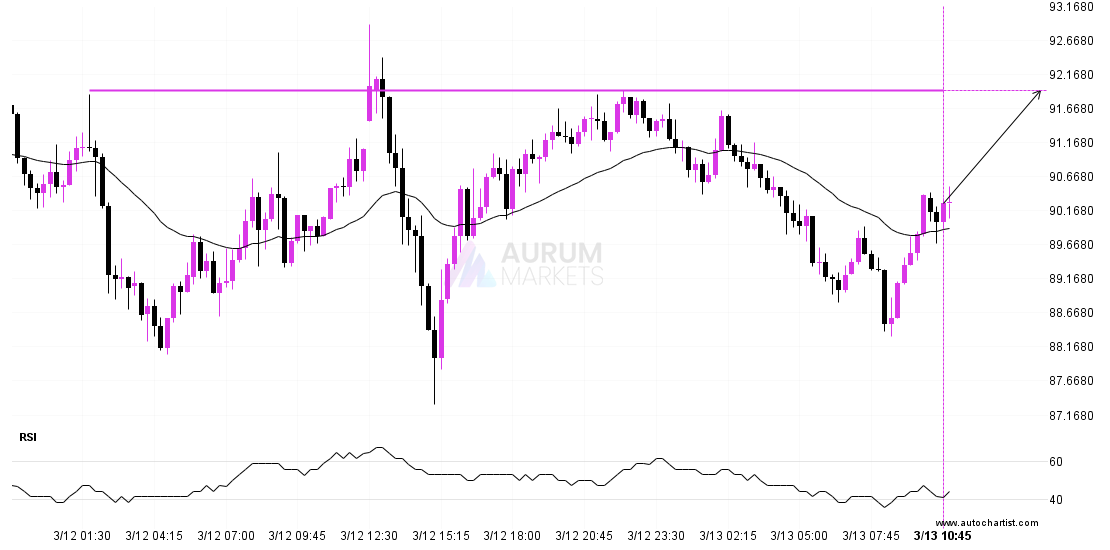
LTCUSD is moving towards a resistance line. Because we have seen it retrace from this level in the past, we could see either a break through this line, or a
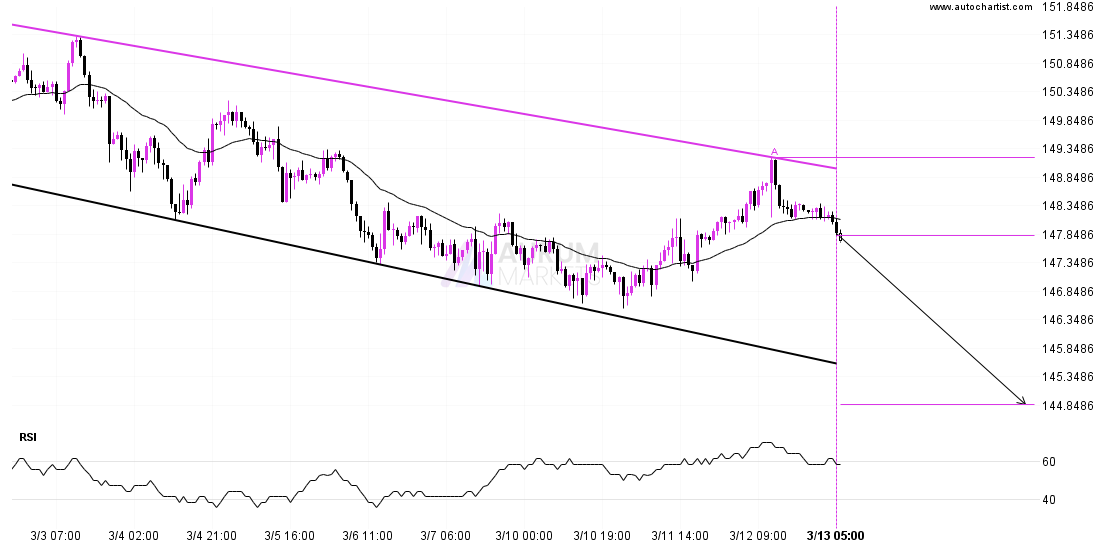
The movement of USDJPY towards the support line of a Channel Down is yet another test of the line it reached numerous times in the past. This line test could
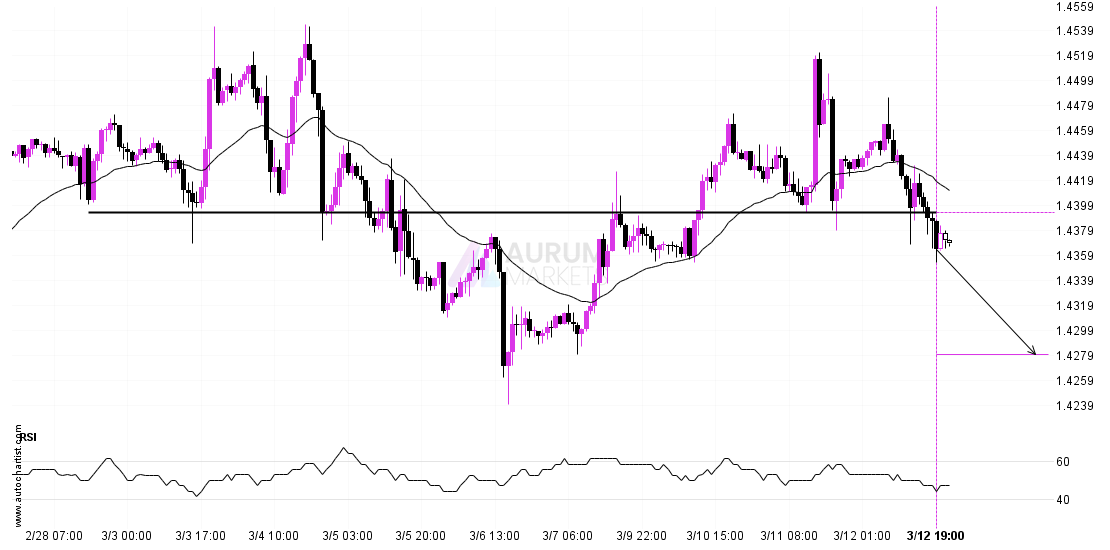
USDCAD has broken through a support line. It has touched this line numerous times in the last 13 days. This breakout shows a potential move to 1.4280 within the next
ASX 225 is moving towards a resistance line which it has tested numerous times in the past. We have seen it retrace from this line before, so at this stage
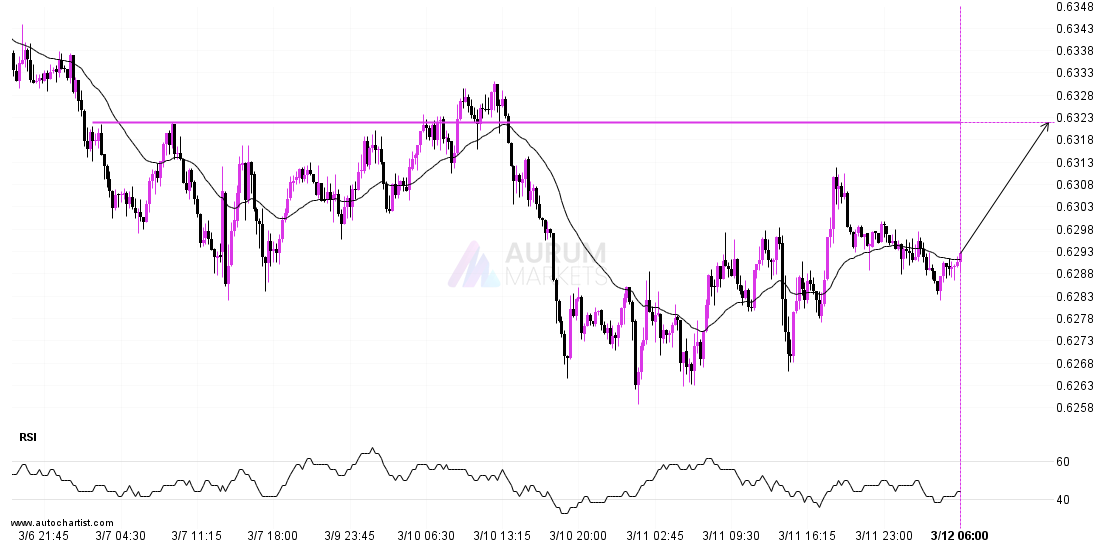
AUDUSD is moving towards a key resistance level at 0.6322. This is a previously tested level for AUDUSD. This could be a good trading opportunity, either at the spot price,
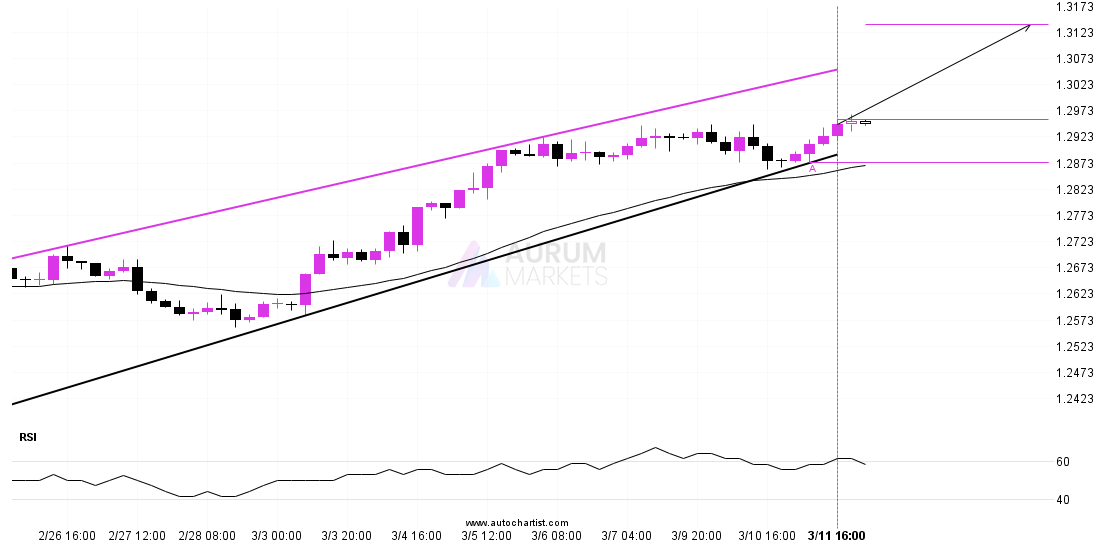
GBPUSD is trapped in a Channel Up formation, implying that a breakout is Imminent. This is a great trade-setup for both trend and swing traders. It is now approaching a
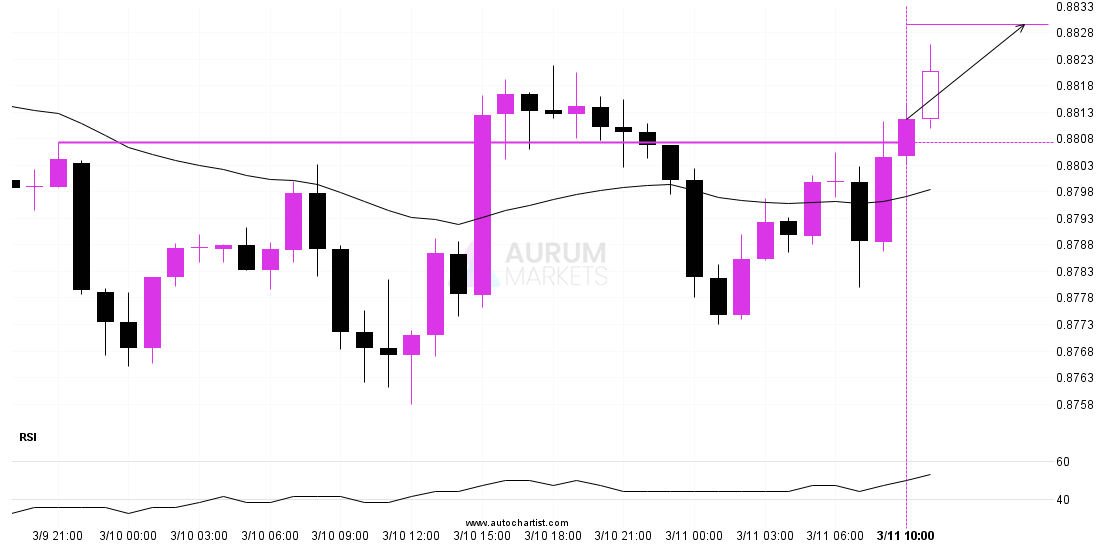
USDCHF has broken through a resistance line. It has touched this line numerous times in the last 2 days. This breakout shows a potential move to 0.8830 within the next