A potential bearish movement on LTCUSDA potential bearish movement on LTCUSD
The movement of LTCUSD towards 91.2100 price line is yet another test of the line it reached numerous times in the past. We could expect this test to happen in

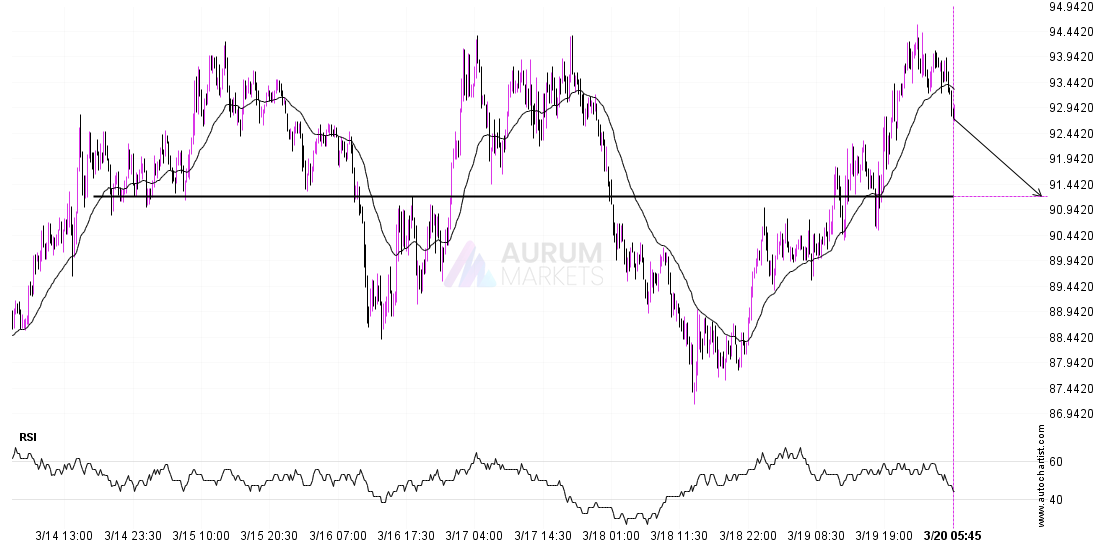
The movement of LTCUSD towards 91.2100 price line is yet another test of the line it reached numerous times in the past. We could expect this test to happen in
Nikkei 225 is moving towards a support line. Because we have seen it retrace from this line before, we could see either a break through this line, or a rebound
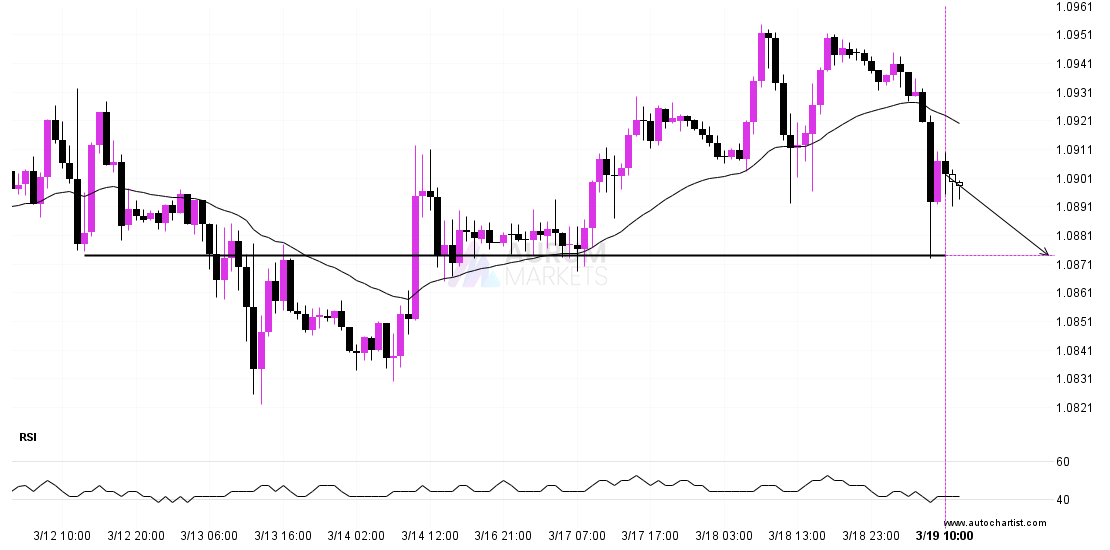
EURUSD is moving towards a line of 1.0874 which it has tested numerous times in the past. We have seen it retrace from this position in the past, so at
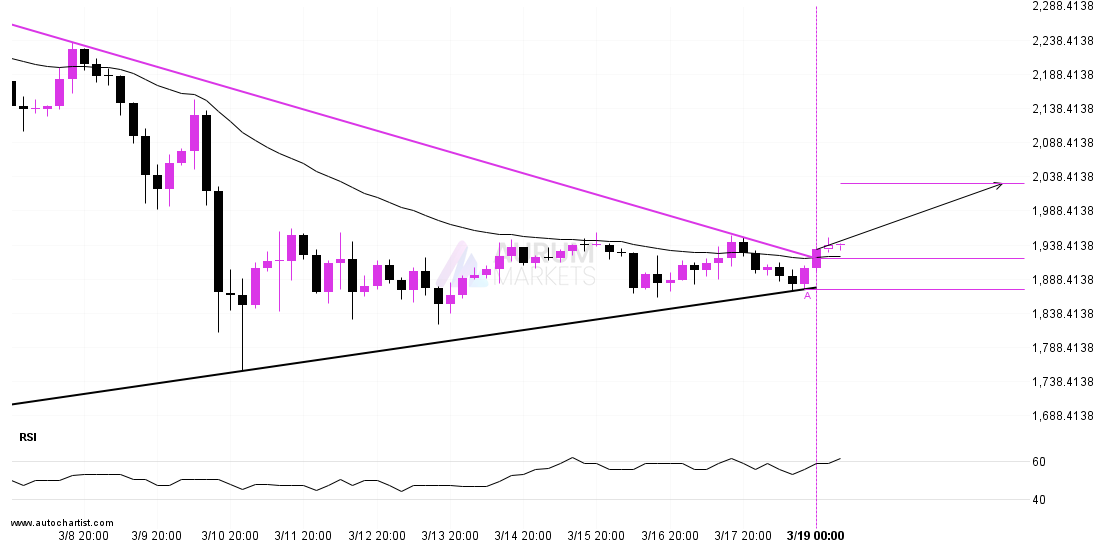
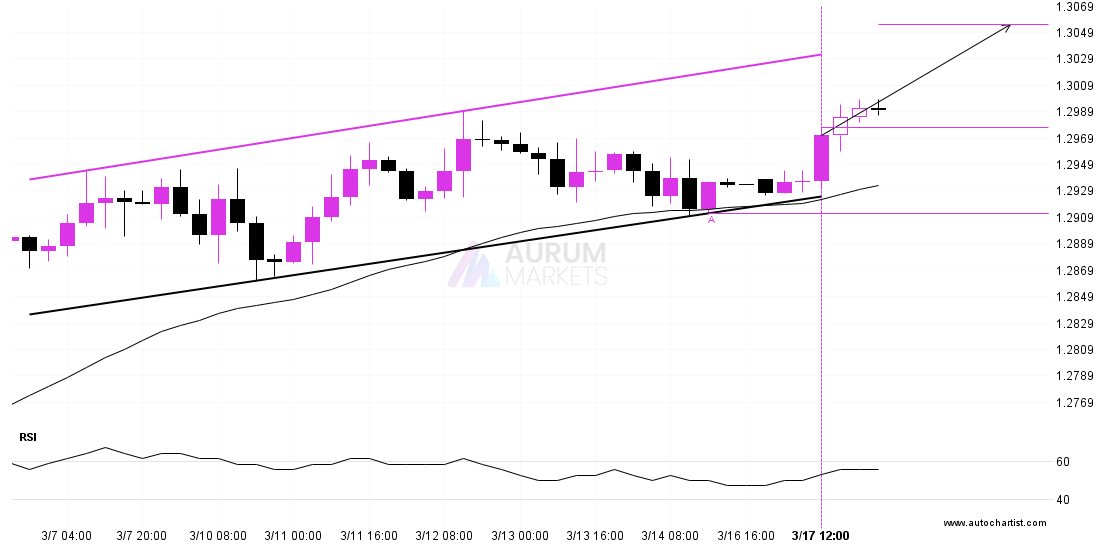
The last 16 4 hour candles on ETHUSD formed a Triangle pattern and broken out through the pattern lines, indicating a possible bullish movement towards the price level of 2029.1264.
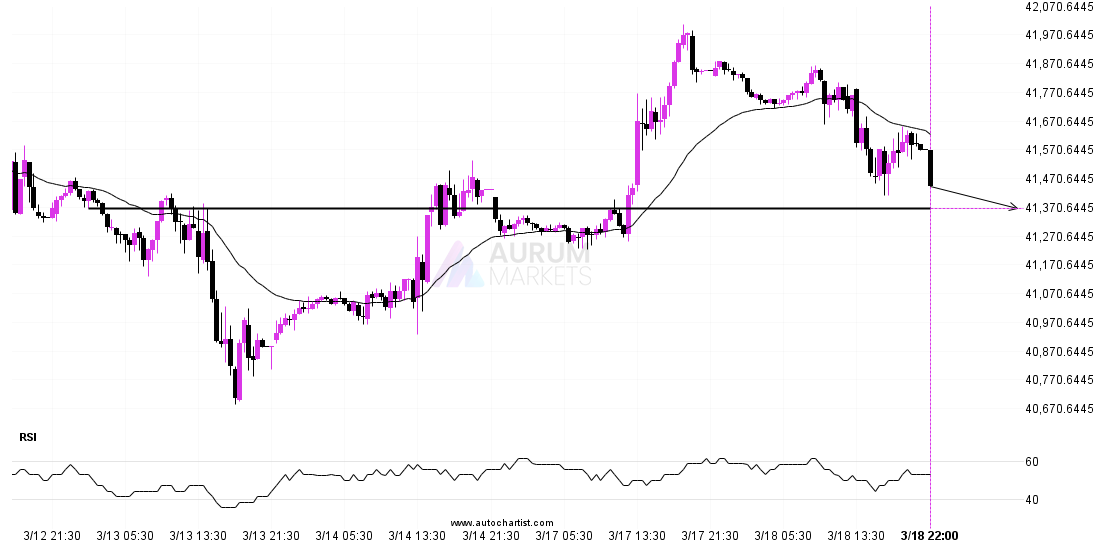
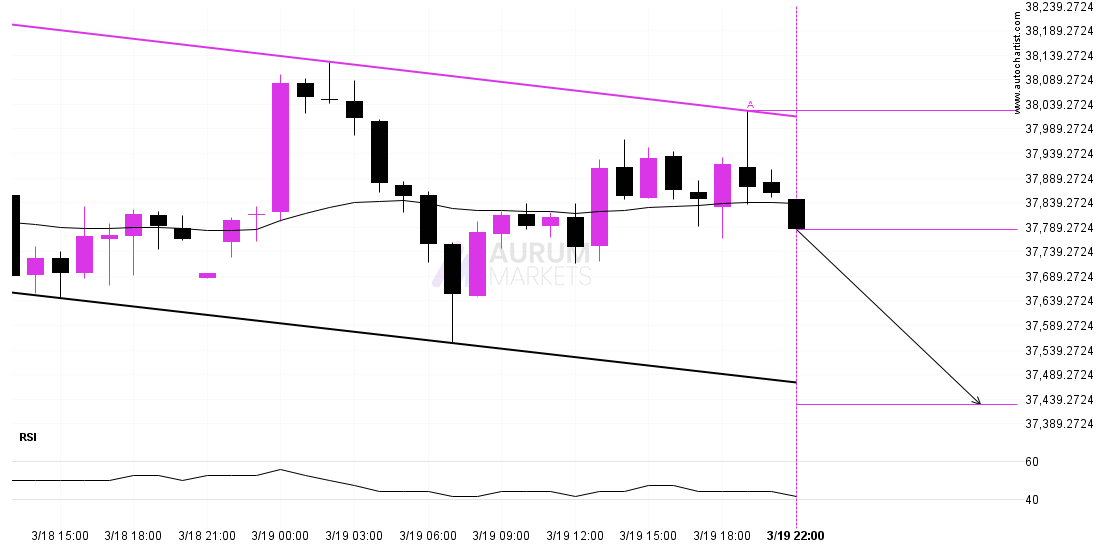
A strong support level has been identified at 41365.8906 on the 30 Minutes DOW 30 chart. DOW 30 is likely to test it soon. Supported by Downward sloping Moving Average
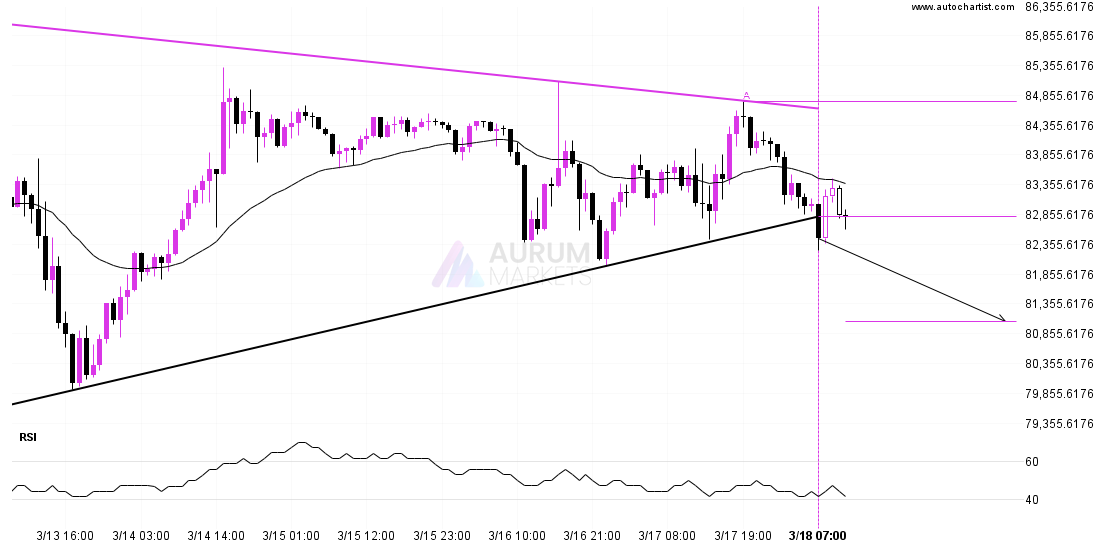
BTCUSD has broken through the support line which it has tested twice in the past. We have seen it retrace from this line before, so one should wait for confirmation

LTCUSD is en route to a very important line that will be a definite deciding factor of what is to come! We may see this trajectory continue to touch and
GBPUSD is moving towards a resistance line which it has tested numerous times in the past. We have seen it retrace from this line before, so at this stage it
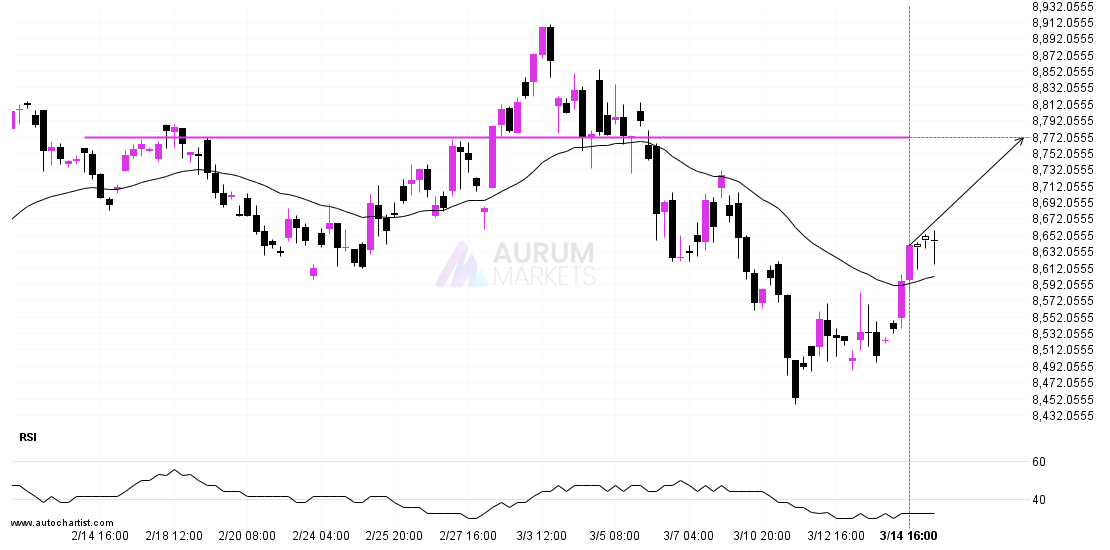
FTSE 100 is heading towards a line of 8771.7402. If this movement continues, the price of FTSE 100 could test 8771.7402 within the next 2 days. But don’t be so
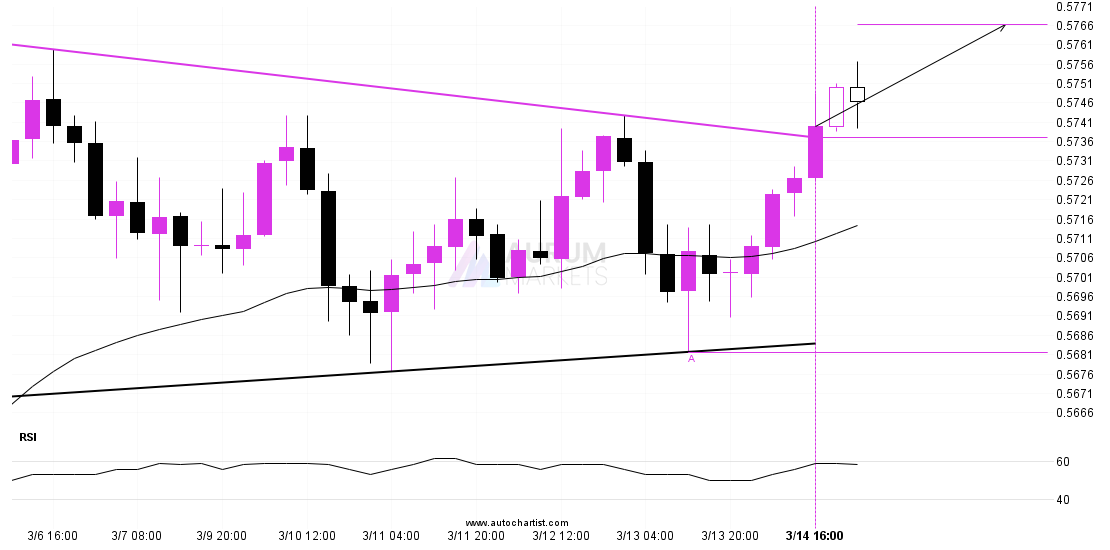
NZDUSD has broken through a resistance line. It has touched this line at least twice in the last 11 days. This breakout may indicate a potential move to 0.5766 within