LTCUSD is on the approachLTCUSD is on the approach
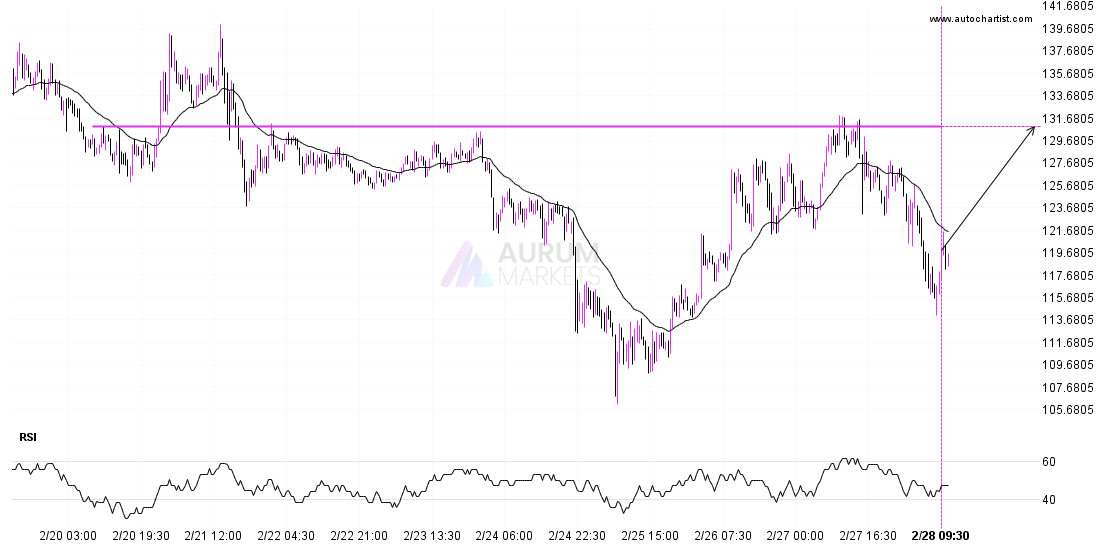
LTCUSD is approaching a resistance line at 130.9400. If it hits the resistance line, it may break through this level to continue the bullish trend, or it may turn around

LTCUSD is approaching a resistance line at 130.9400. If it hits the resistance line, it may break through this level to continue the bullish trend, or it may turn around

BTCUSD is moving towards a support line. Because we have seen it retrace from this line before, we could see either a break through this line, or a rebound back
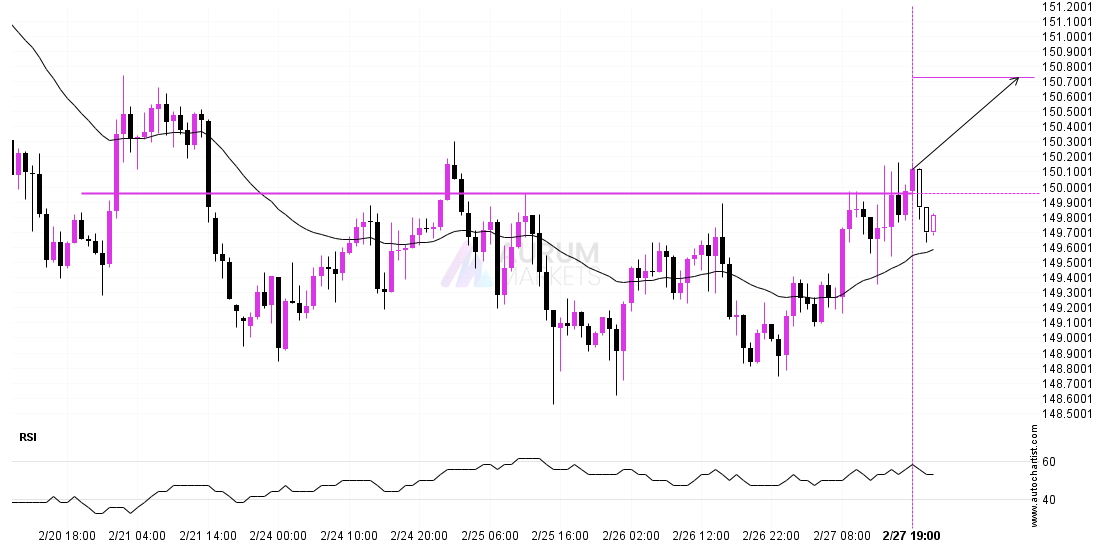
USDJPY has broken through a resistance line. It has touched this line numerous times in the last 7 days. This breakout shows a potential move to 150.7258 within the next
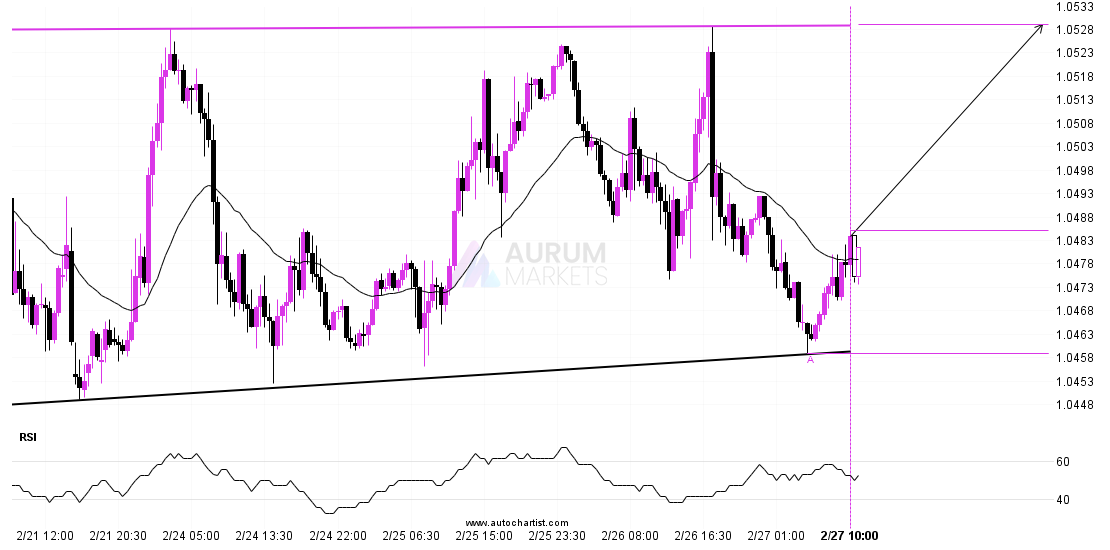
An emerging Ascending Triangle has been detected on EURUSD on the 30 Minutes chart. There is a possible move towards 1.0529 next few candles. Once reaching support it may continue

USDCHF has broken through a line of 0.8966 and suggests a possible movement to 0.8996 within the next 18 hours. It has tested this line numerous times in the past,
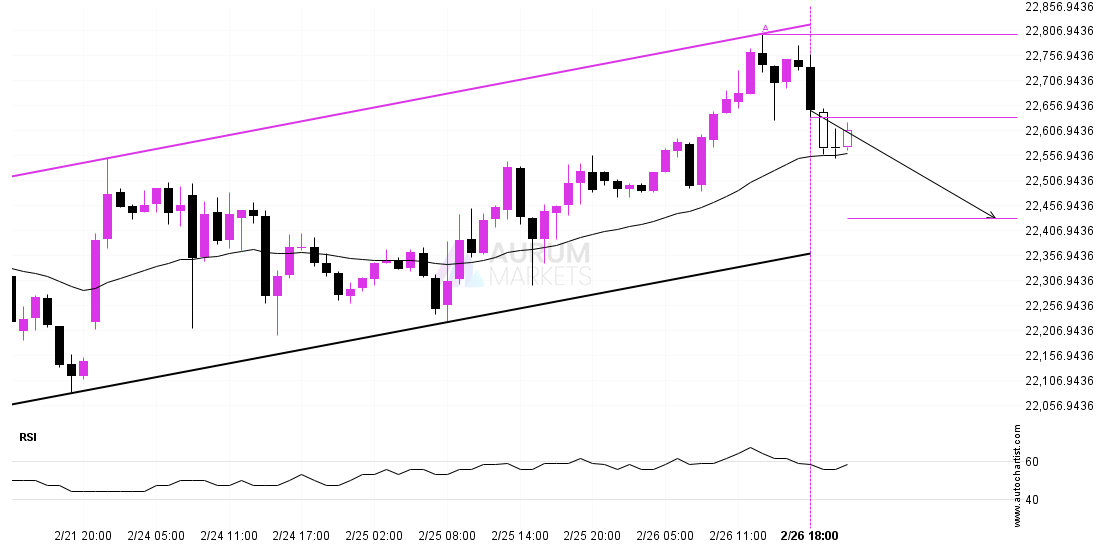
DAX 40 is heading towards the support line of a Channel Up and could reach this point within the next 16 hours. It has tested this line numerous times in
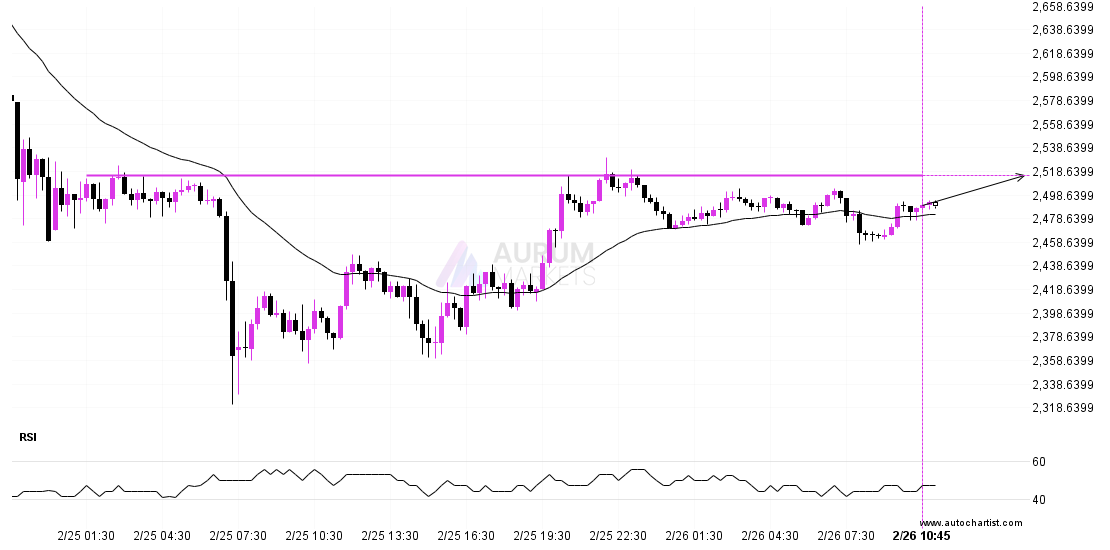
The movement of ETHUSD towards 2514.8000 price line is yet another test of the line it reached numerous times in the past. We could expect this test to happen in
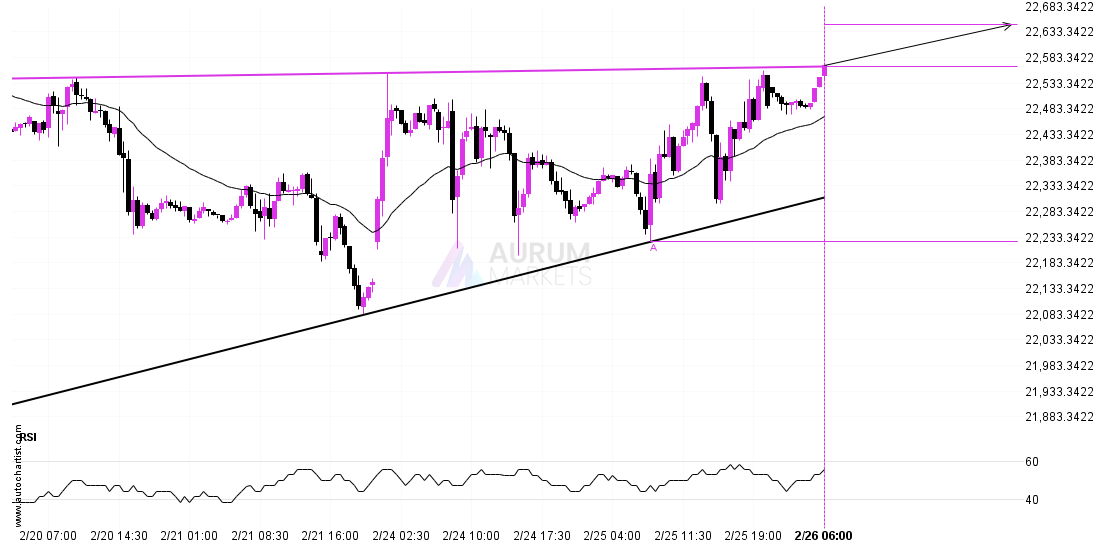
DAX 40 has broken through a resistance line of a Ascending Triangle and suggests a possible movement to 22646.4403 within the next 2 days. It has tested this line in

FTSE 100 is heading towards 8510.9004 and could reach this point within the next 4 days. It has tested this line numerous times in the past, and this time could
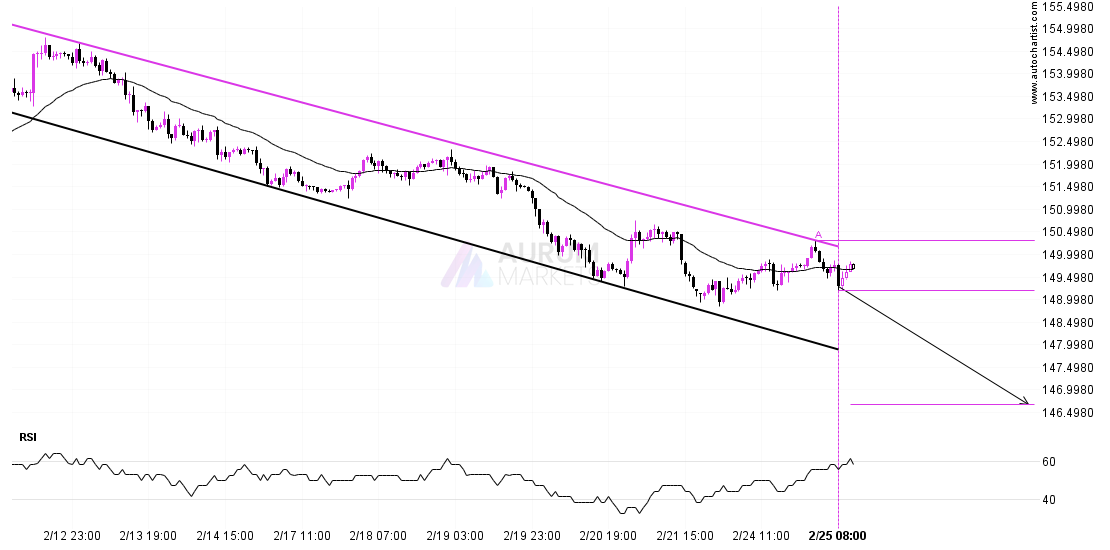
Emerging Channel Down detected on USDJPY – the pattern is an emerging one and has not yet broken through resistance, but the price is expected to move up over the